1. OpenPNM基本介绍
用于执行多孔介质孔隙网络建模和CFD的开源Python包,模型为球棍网络模型
总的来讲,OpenPNM有五个部分组成,使用步骤也是依次执行这五个部分的代码:
Network;Geometry;Phase;Physics;Algorithm
Network: 生成一个网络实体,包括孔隙(pore)的空间位置,数量,及孔隙的相对距离和孔隙之间的连接情况。
Geometry: 网络模型生成后,孔隙的位置和个数已经有了,但是孔隙(球)与流道(棍)几何信息需要在geometry中确定。
Phase: 网格有了,孔隙和流道几何参数有了,需要明确流动相的参数。
Physics: 定义流动的物理模型及所需参数。
Algorithm:定义算法和边界条件
2. Network的相关设置
2.1 创建新的网络模型并快速可视化
OpenPNM包括各种网络模型生成器。这里介绍一些常见的网络模型,实现可视化可以直接在Spyder里运行,想要完全可视化最好在专用软件(如paraview或draongfly)中完成。
import openpnm as op
import numpy as np
import matplotlib.pyplot as plt
op.visualization.set_mpl_style()
Definition : set_mpl_style()
Prettifies matplotlib's output by adjusting fonts, markersize etc.
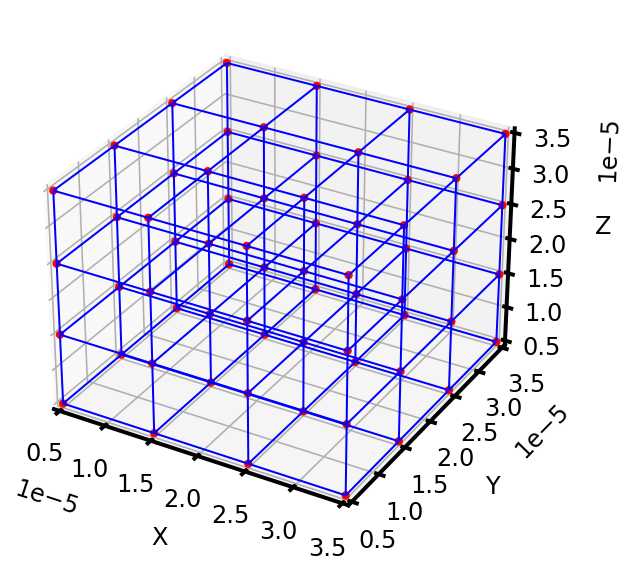
2.1.1 从最简单的立方体网络开始:
#快速生成网络模型可以直接调用network里的相关函数
pn = op.network.Cubic(shape=[4, 4, 4], spacing=1e-5)
#Shape[x,y,z]中的x,y,z分别为模型中在x,y,z轴上pore的个数
#spacing指孔隙间距,如果x,y,z轴方向上的孔隙间距相同则spacing=常数,如果不同则spacing=[a,b,c]

#采用下面的代码进行快速可视化,可视化选项后面探讨
ax = op.visualization.plot_coordinates(pn)#将pore可视化为点
ax = op.visualization.plot_connections(pn, ax=ax)#可视化流道为线
Definition : Cubic(shape, spacing=[1, 1, 1], connectivity=6, *, conns=None, coords=None, name='net') decorator(f)
Simple cubic lattice with connectivity from 6 to 26Though simple, the Cubic network offers many advantages such as easy visualization and accurate determination of domain area and length in transport calculations.
Parameters
shape:array_like
The [Nx, Ny, Nz] size of the network in terms of the number of pores in each direction. For a 2D networkspacing:array_like, optional
The spacing between pore centers in each direction. If not given, then [1, 1, 1] is assumed.connectivity:int, optional
The number of connections to neighboring pores. Connections are made symmetrically to any combination of face, edge, or corners neighbors. The default is 6 to create a simple cubic structure, but options are:
6 : Faces only
14 : Faces and Corners
18 : Faces and Edges
20 : Edges and Corners
26 : Faces, Edges and CornersFor a more random distribution of connectivity, use a high connectivity (i.e. 26) and then delete a fraction of the throats using openpnm.topotools.reduce_coordination. Also note that corners-only and edges-only are not permitted since they create disconnected networks. If you require one of these topologies you can specify 14 or 18, then use openpnm.topotools.trim to remove the face-to-face connections, which can be identified by looking for throats with a length equal to the network spacing.
结果如下:
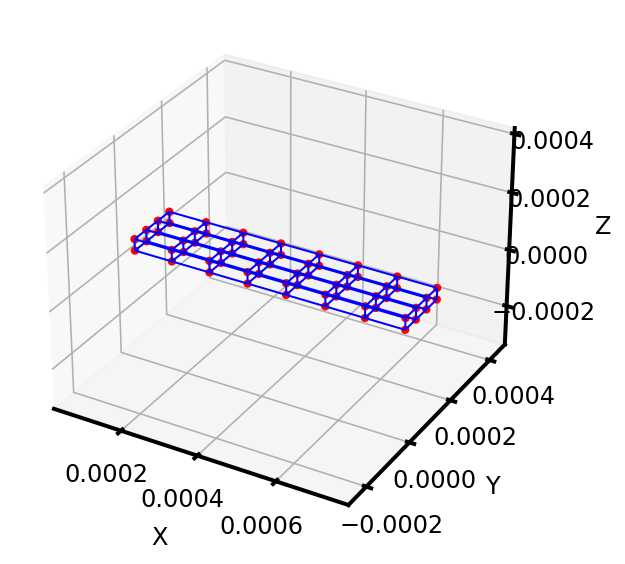
立方体网格模型的形状间距都可以改变
pn = op.network.Cubic(shape=[8, 4, 2], spacing=[10e-5, 5e-5, 4e-5])
ax = op.visualization.plot_coordinates(pn)
ax = op.visualization.plot_connections(pn, ax=ax)
孔隙连接的流道数量也可以设置
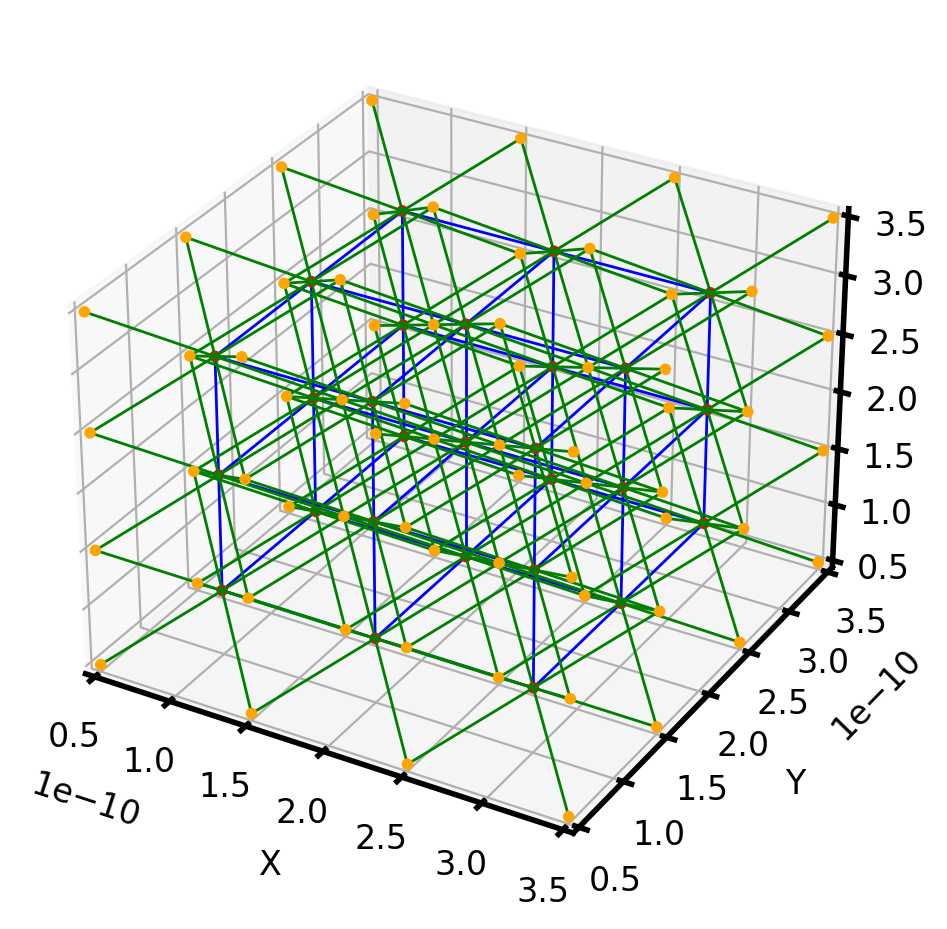
pn = op.network.Cubic(shape=[4, 4, 4], connectivity=26)
#spacing不写则默认流道长度为1
#connectivity Must be 6, 14, 18, 20 or 26.
ax = op.visualization.plot_coordinates(pn)
ax = op.visualization.plot_connections(pn, ax=ax)
OpenPNM可以通过:
np.random.seed(0)
np.random.randint
随机删除流道或者孔隙
pn = op.network.Cubic(shape=[4, 4, 4], connectivity=26)
np.random.seed(0)
'''
seed( ) 用于指定随机数生成时所用算法开始的整数值。
1.如果使用相同的seed( )值,则每次生成的随机数都相同;
2.如果不设置这个值,则系统根据时间来自己选择这个值,此时每次生成的随机数因时间差异而不同。
3.设置的seed()值仅一次有效
'''
drop = np.random.randint(0, pn.Nt, 500)
'''
从0(低值)到pn.Nt(高值)中随机生成一个size为500的列表赋予给drop,列表中的元素可以重复
'''
op.topotools.trim(network=pn, throats=drop)
#drop中所有的元素对应流道的编号,删除这些元素对应编号的流道
ax = op.visualization.plot_coordinates(pn)
ax = op.visualization.plot_connections(pn, ax=ax)
'''
print('The total number of pores on the network is:', pn.num_pores())
print('A short-cut to the total number of pores is:', pn.Np)
print('The total number of throats on the network is:', pn.num_throats())
print('A short-cut to the total number of throats is:', pn.Nt)
print('A list of all calculated properties is availble with:\n', pn.props())
'''
关于numpy.random.randint()函数的用法:
numpy.random.randint(low, high=None, size=None, dtype='l')
函数的作用是,返回一个随机整数,范围从低(包括)到高(不包括),如果没有写参数high的值,则 返回0到low的值。
参数如下:
low: int
生成的数值最低要大于等于low。
(hign = None时,生成的数值要在0到low区间内)high: int (可选)
如果使用这个值,则生成的数值在low到high之间。size: int or tuple of ints(可选)
输出随机数的尺寸,比如size = (m * n* k)则输出同规模即m * n* k个随机数。默认是None的,仅仅返回满足要求的单一随机数。dtype: dtype(可选):
想要输出的格式。如int64、int等等输出:
out: int or ndarray of ints
一个随机数或随机数数组
2.1.2 查看网络模型的详细信息
print(pn)
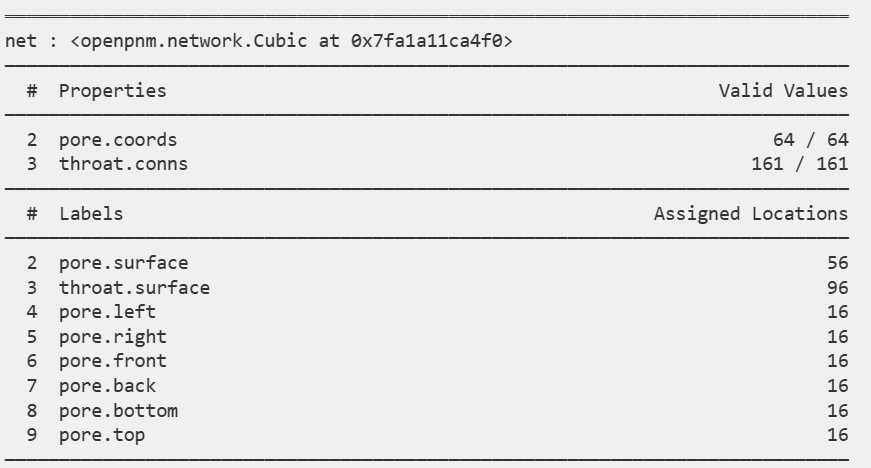
或者,直接打印输出相关标签即可获得相应的流道或者孔隙的编号
Ps = pn.pores('back')
print("The following pores are labelled 'back':", Ps)
Ps = pn.pores(['back', 'left'])
print("The following pores are labelled 'back' AND 'left':", Ps)
'''
The following pores are labelled 'back': [12 13 14 15 28 29 30 31 44 45 46 47 60 61 62 63]
The following pores are labelled 'back' AND 'left': [ 0  1  2  3  4  5  6  7  8  9 10 11 12 13 14 15 28 29 30 31 44 45 46 47
 60 61 62 63]
'''

Ts = pn.throats('surface')
print("The following throats are labelled 'surface':", Ts)
'''
The following throats are labelled 'surface': [  0   1   2   3   4   5   6  11  12  14  15  16  17  18  19  20  21  22
  23  24  27  28  29  30  32  33  34  35  36  37  38  41  42  43  44  45
  48  49  52  53  56  58  59  61  64  67  68  69  71  73  76  77  80  83
  85  86  89  90  91  93  97  99 100 105 109 110 111 112 113 115 119 120
 121 122 124 126 130 131 133 134 135 136 139 140 141 143 144 146 147 148
 149 150 151 153 154 160]
'''
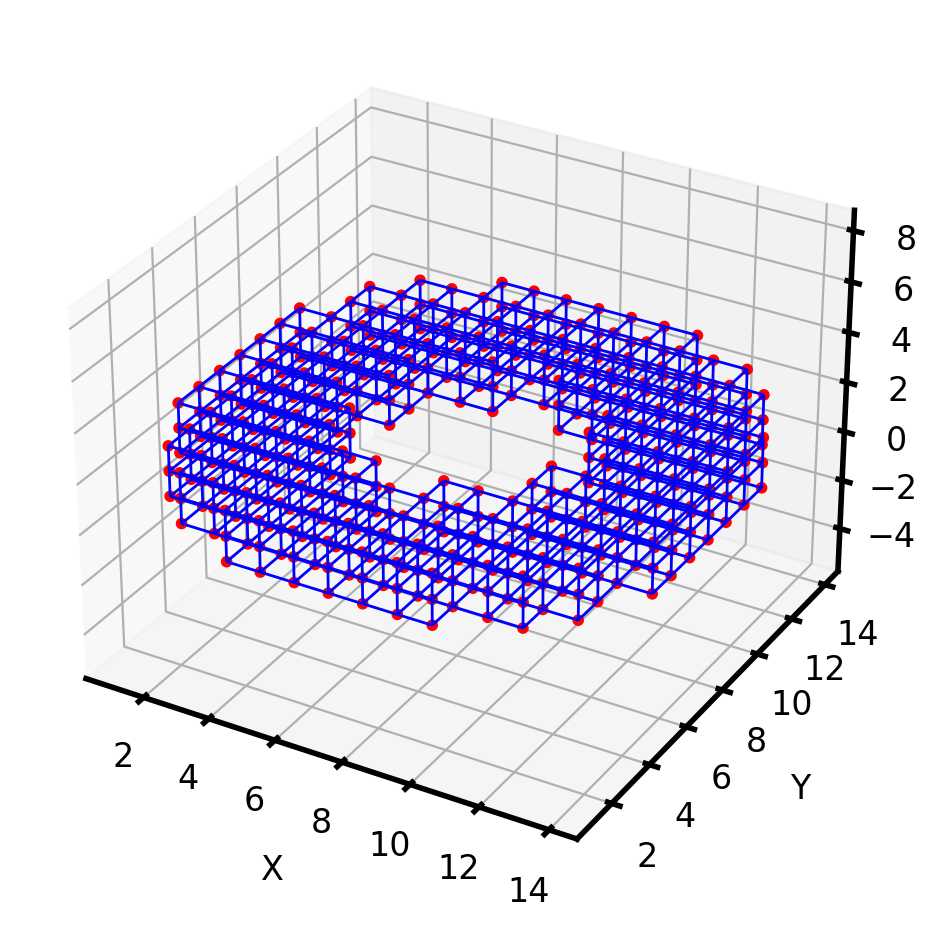
2.1.3 立方体模板
OpenPNM可以制作具有任意形状的立方网络,例如球体或圆柱体,甚至更复杂的网络,尽管它仍由立方体单元组成。
im = op.topotools.template_cylinder_annulus(z=3, r_outer=8, r_inner=3)
pn = op.network.CubicTemplate(template=im)
ax = op.visualization.plot_coordinates(pn)
ax = op.visualization.plot_connections(pn, ax=ax)
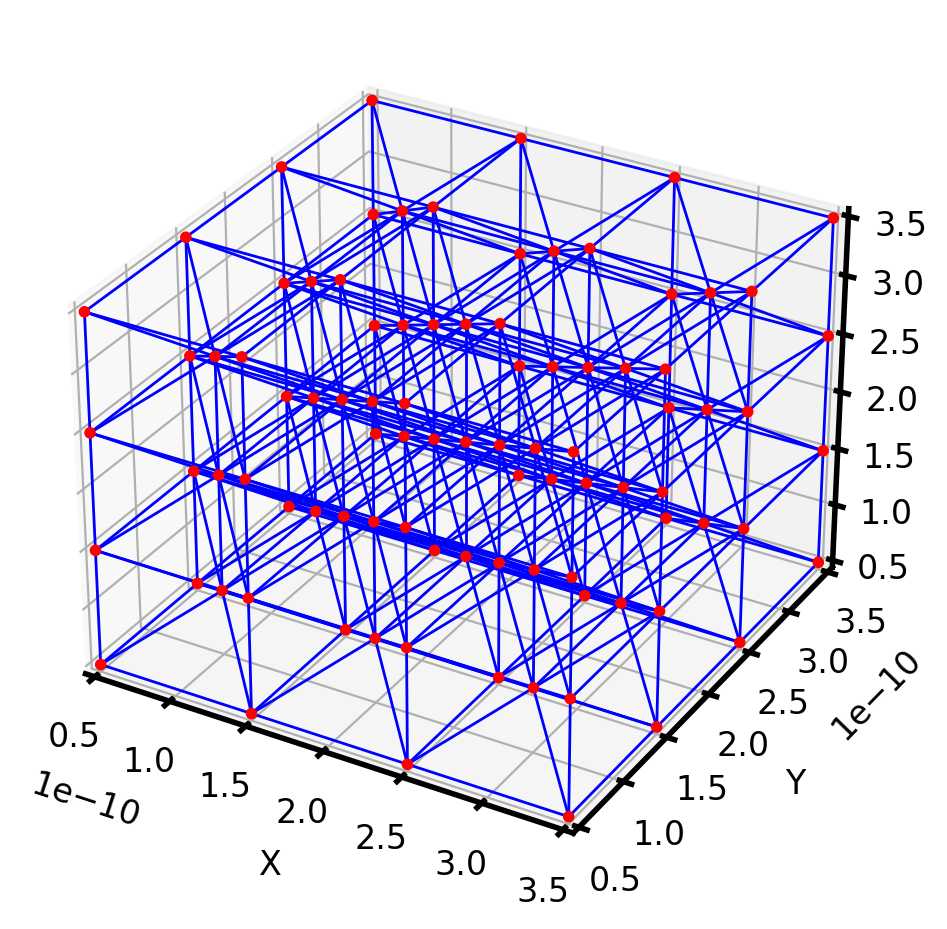
其他立方晶格网络
import openpnm as op
import numpy as np
import matplotlib.pyplot as plt
op.visualization.set_mpl_style()
fcc = op.network.FaceCenteredCubic(shape=[4, 4, 4], spacing=1e-5)
ax = op.visualization.plot_connections(fcc)
op.visualization.plot_coordinates(fcc, ax=ax)
#面心立方晶格

bcc = op.network.BodyCenteredCubic(shape=[4, 4, 4], spacing=1e-5)
ax = op.visualization.plot_connections(bcc)
ax = op.visualization.plot_coordinates(bcc, ax=ax);
#体心立方晶格
Definition : FaceCenteredCubic(shape, mode='sc', spacing=1, *, conns=None, coords=None, name='net')
Face-Centered Cubic lattice which is a simple cubic lattice with additional pores located on each face of the cubic unit cells. These pores are connected to each other and their diagonal neighbors.Parameters
shape:array_like
The number of pores forming the corners of the unit cell in each directionspacing:array_like (optional)
The spacing between pores that form the corners of the unit cells%(Network.parameters)s
See Also
Cubic BodyCenteredCubicNotes
The pores are labelled as beloning to 'corner_sites' and 'face_sites' Throats are labelled by the which type of pores they connect, e.g. 'throat.corner_to_body'.
print(bcc)
详情里多了体心孔隙,角孔隙,和相应的流道
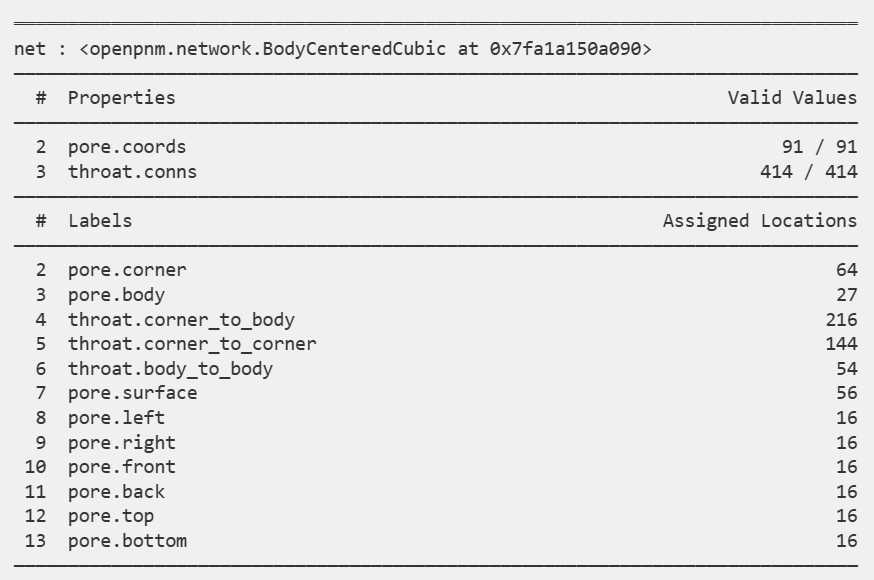
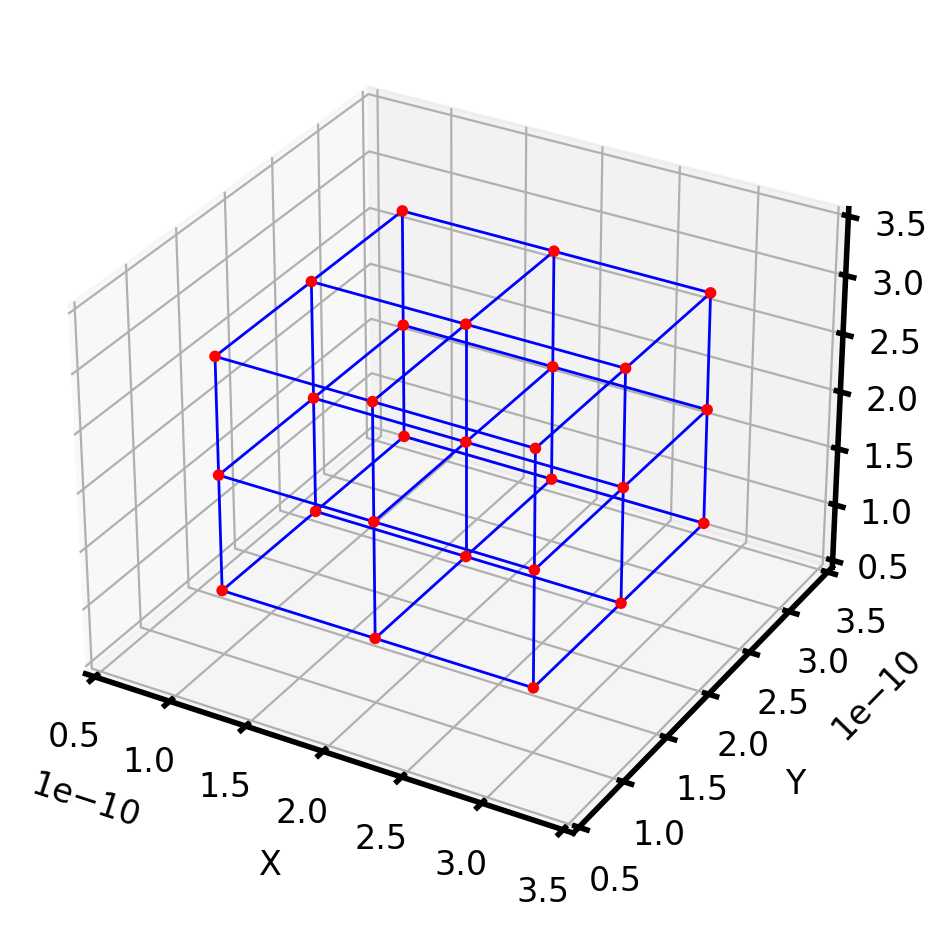
利用标签可以选择想要看到的部分网络模型
ax = op.visualization.plot_connections(bcc, throats=bcc.throats('body_to_body'))
ax = op.visualization.plot_coordinates(bcc, pores=bcc.pores('body'), ax=ax)
ax = op.visualization.plot_connections(bcc, throats=bcc.throats('body_to_body'))
ax = op.visualization.plot_coordinates(bcc, pores=bcc.pores('body'), ax=ax)
ax = op.visualization.plot_connections(bcc, throats=bcc.throats('corner_to_body'), c='g', ax=ax)
ax = op.visualization.plot_coordinates(bcc, pores=bcc.pores('corner'), ax=ax, c='orange')
#c=  表示定义颜色,放在最后
2.1.4 随机网络模型:Delaunay and Voronoi Tessellations
Delaunay and Voronoi Tessellations的相关解释可以参考:https://www.cnblogs.com/sddai/p/5740172.html
OpenPNM 还可以轻松处理随机网络,因为拓扑是以完全通用的方式存储的,将在后面的教程中讨论。
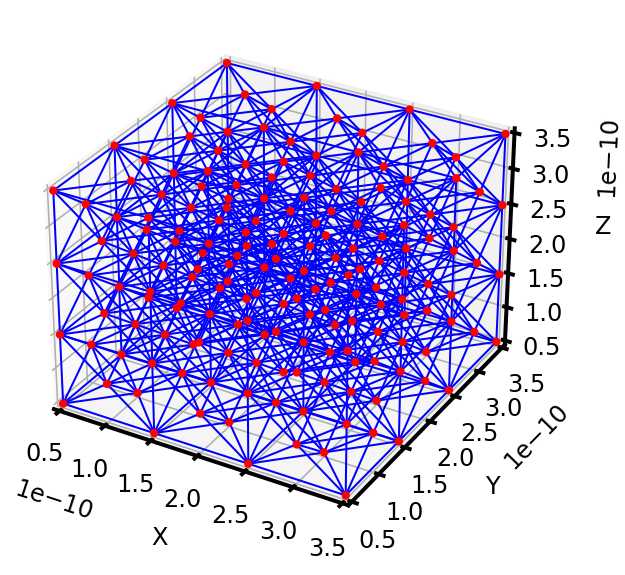
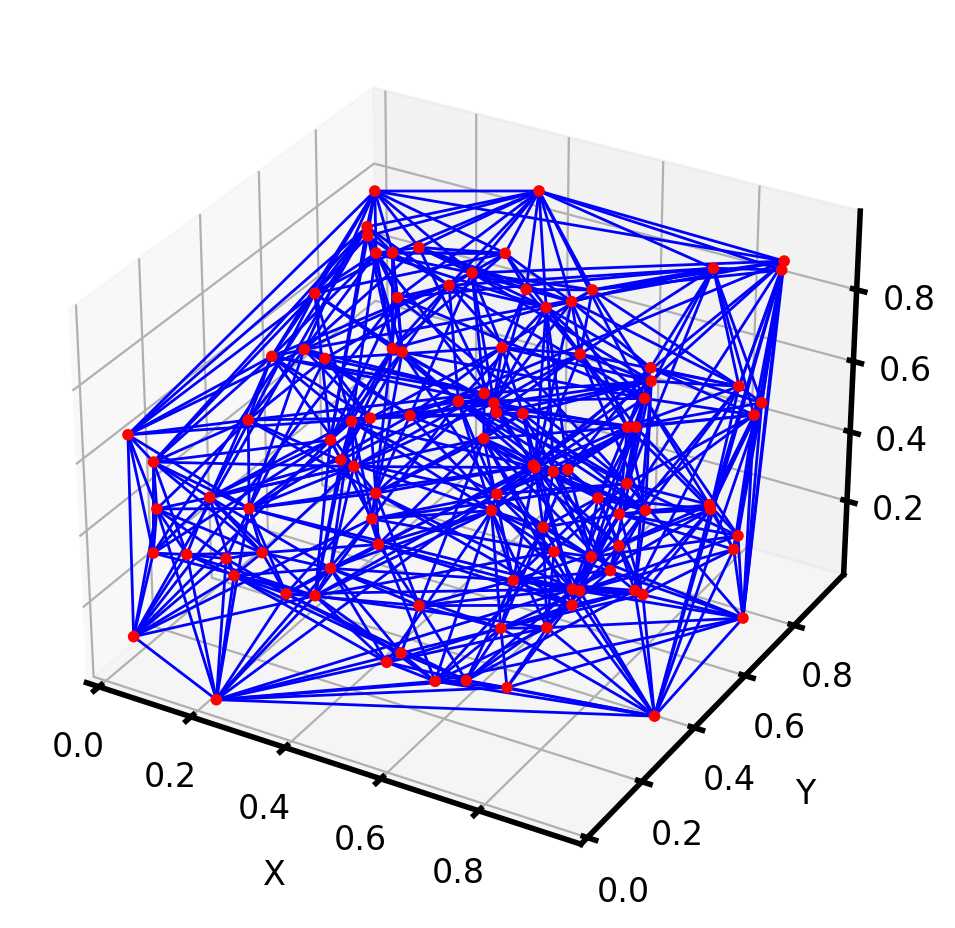
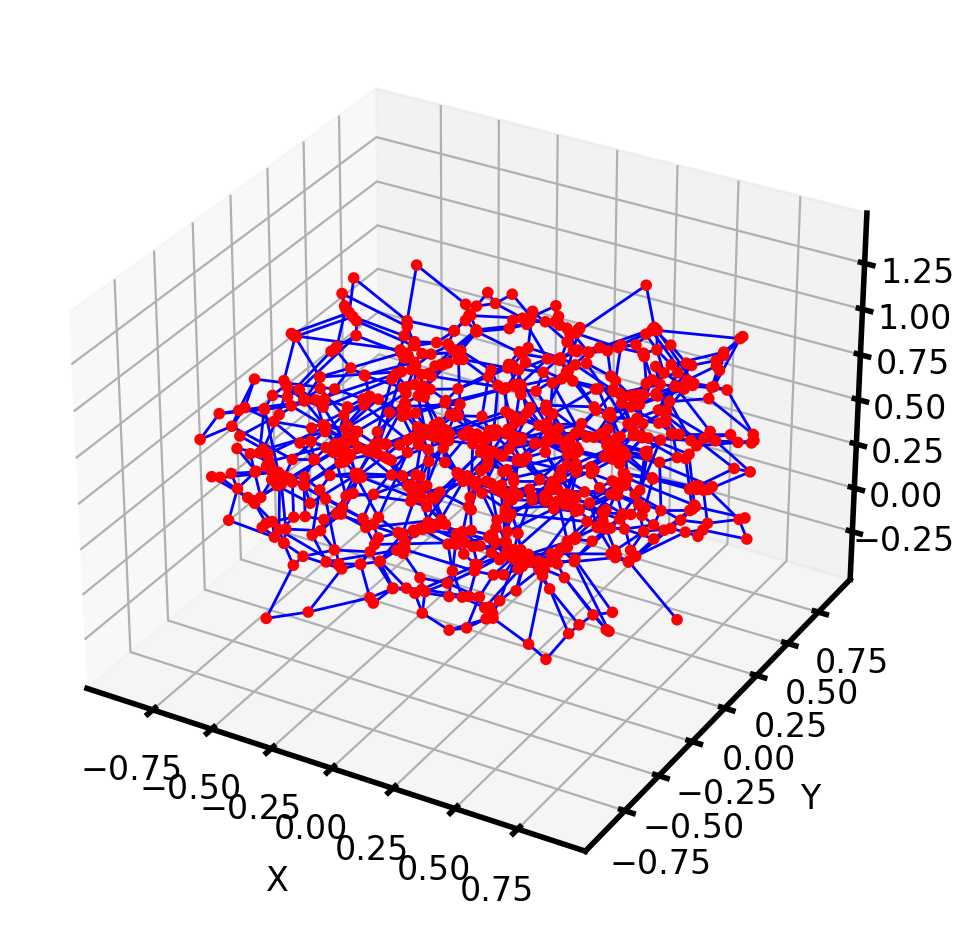
下面是一组随机基点的Voronoi Tessellations:
pn = op.network.Voronoi(shape=[1, 1, 1], points=100)
ax = op.visualization.plot_connections(pn)
ax = op.visualization.plot_coordinates(pn, ax=ax)
Definition : Voronoi(shape, points, trim=True, reflect=True, *, conns=None, coords=None, name='net')
Random network formed by Voronoi tessellation of arbitrary base points.Parameters
points:array_like or int
Can either be an N-by-D array of point coordinates which will be used directly, or a scalar value indicating the number of points to generate. If 3D points are supplied, and a 2D shape is specified, then the z-coordinate is ignored.See Notes for more details.shape:array_like
The size and shape of the domain:
| shape | result |
| ------------ | ------------ |
| [x, y, z] | A 3D cubic domain of dimension x, y and z |
| [x, y, 0] | A 2D square domain of size x by y |
trim:bool, optional
If True (default) then all Voronoi vertices laying outside the domain will be removed.reflect:bool, optional
If True (default) then the base points will be reflected across all the faces of the domain prior to performing the tessellation. This feature is best combined with trim=True to make nice flat faces on all sides of the domain.%(Network.parameters)s
Notes
These points are used by the Voronoi tessellation, meaning these points will each lie in the center of a Voronoi cell, so they will not be the pore centers. The number of pores in the returned network will greater that the number of points supplied or requested.
It is also possible to generate circular [r, 0], cylindrical [r, z], and spherical domains [r], but this feature does not quite work as desired. It does not produce a truly clean outer surface since the tessellation are conducted in cartesian coordinates, so the circular and spherical surfaces have artifacts. Scipy recently added the ability to do tessellations on spherical surfaces, for geological applications, but this is not flexible enough, yet.
Delaunay tessellation
Definition : Delaunay(f) Delaunay(shape, points, reflect=True, trim=True, *, conns=None, coords=None, name='net')
Random network formed by Delaunay tessellation of arbitrary base pointsParameters
points:array_like or int
Can either be an N-by-D array of point coordinates which will be used, or a scalar value indicating the number of points to generate. If 3D points are supplied, and a 2D shape is specified, then the z-coordinate is ignored.shape:array_like
The size and shape of the domain:[x, y, z]
A 3D cubic domain of dimension x, y and z[x, y, 0]
A 2D square domain of size x by ytrim:bool, optional
If True (default) then all vertices laying outside the domain will be removed. This is only useful if reflect=True.reflect:bool, optional
If True (default) then the base points will be reflected across all the faces of the domain prior to performing the tessellation. This feature is best combined with trim=True to prevent unreasonably long connections between points on the surfaces.%(Network.parameters)s
Notes
It is also possible to generate circular [r, 0], cylindrical [r, z], and spherical domains [r], but this feature does not quite work as desired. It does not produce a truly clean outer surface since the tessellation are conducted in cartesian coordinates, so the circular and spherical surfaces have artifacts. Scipy recently added the ability to do tessellations on spherical surfaces, for geological applications, but this is not flexible enough, yet.
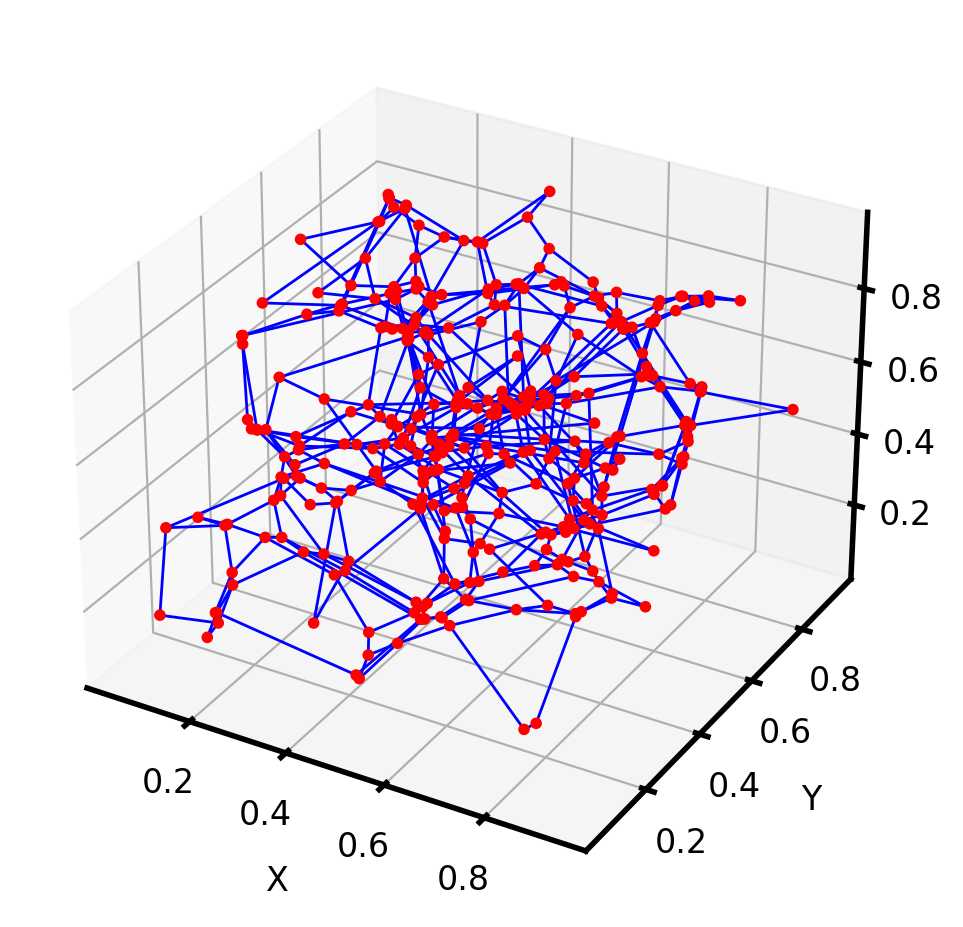
pn = op.network.Delaunay(shape=[1, 1, 1], points=100)
ax = op.visualization.plot_connections(pn)
ax = op.visualization.plot_coordinates(pn, ax=ax)
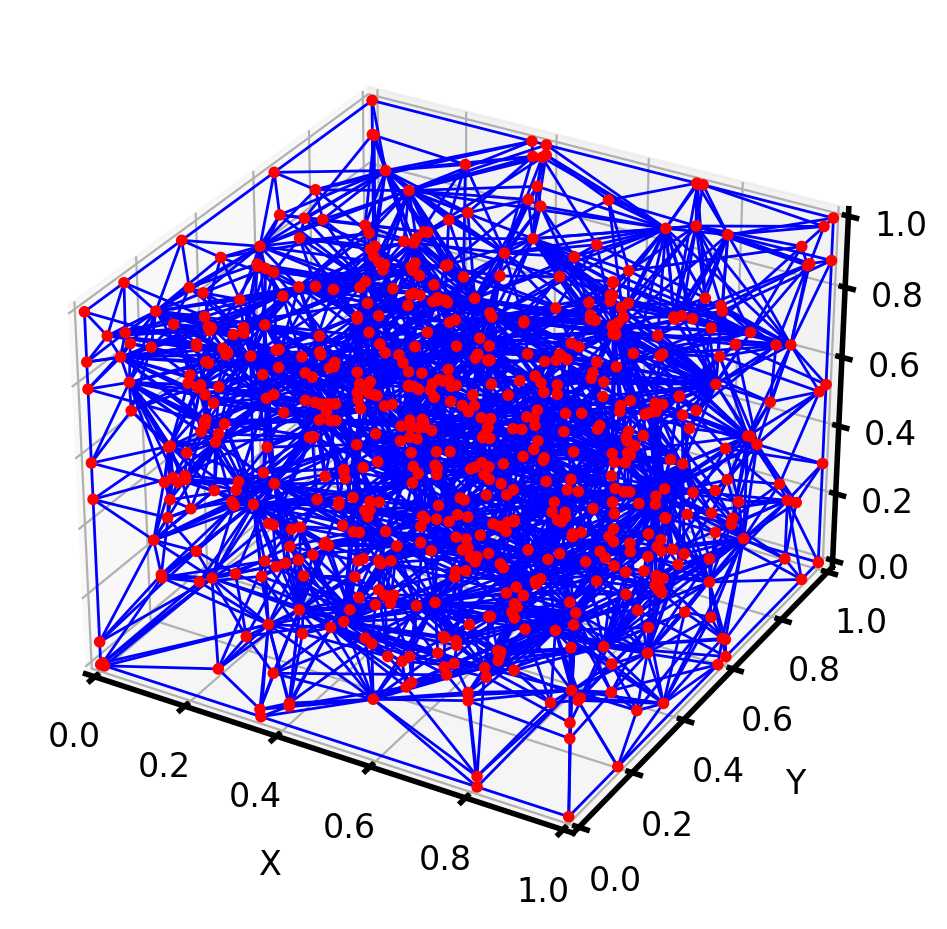
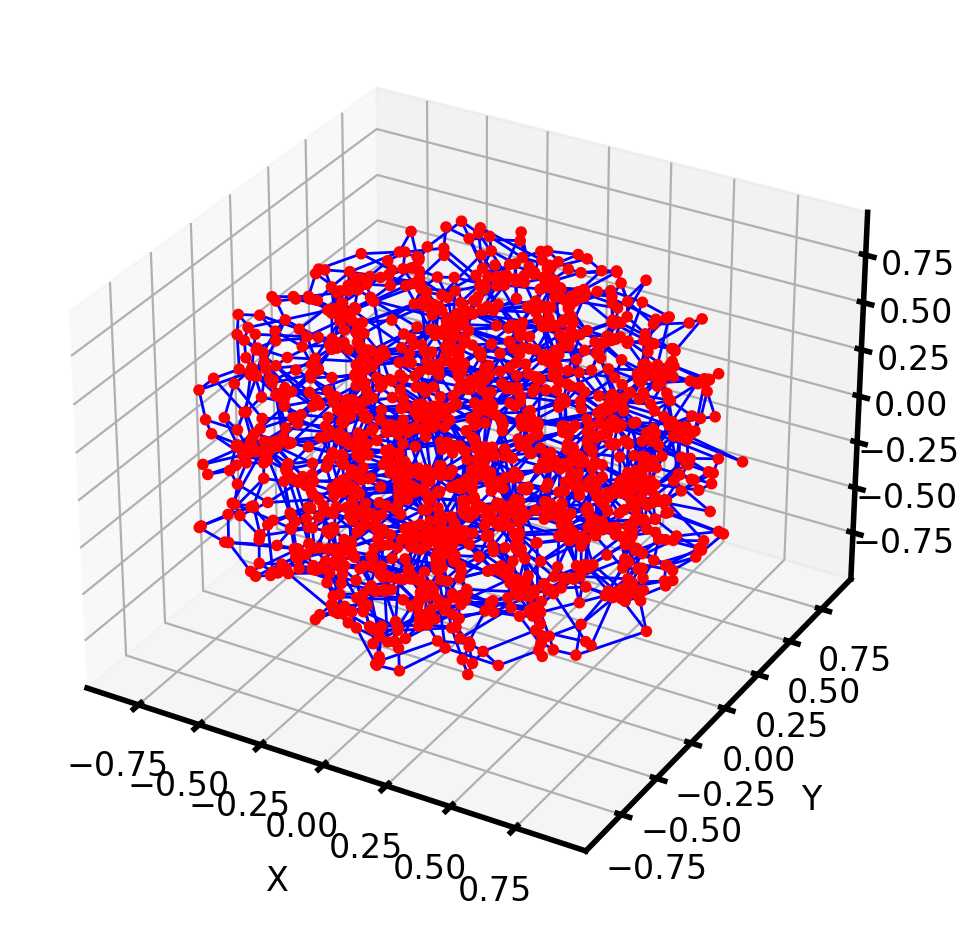
还可以组合成一个双网络,其中Voronoi和Delaunay网络相互渗透并通过额外的流道连接:
pn = op.network.DelaunayVoronoiDual(shape=[1, 1, 1], points=100)
ax = op.visualization.plot_connections(pn)
ax = op.visualization.plot_coordinates(pn, ax=ax);
也可以创建圆柱形和球形的这些晶格。[x,y,z]为笛卡尔坐标指,[r z] 假设圆柱形,r为半径,z为高度,[r] 假设球形
#圆柱
cyl = op.network.Voronoi(shape=[1, 1], points=200)
ax = op.visualization.plot_connections(cyl)
ax = op.visualization.plot_coordinates(cyl, ax=ax);

#球
sph = op.network.Voronoi(shape=[1], points=400)
ax = op.visualization.plot_connections(sph)
ax = op.visualization.plot_coordinates(sph, ax=ax);
2.1.5 导入网络模型
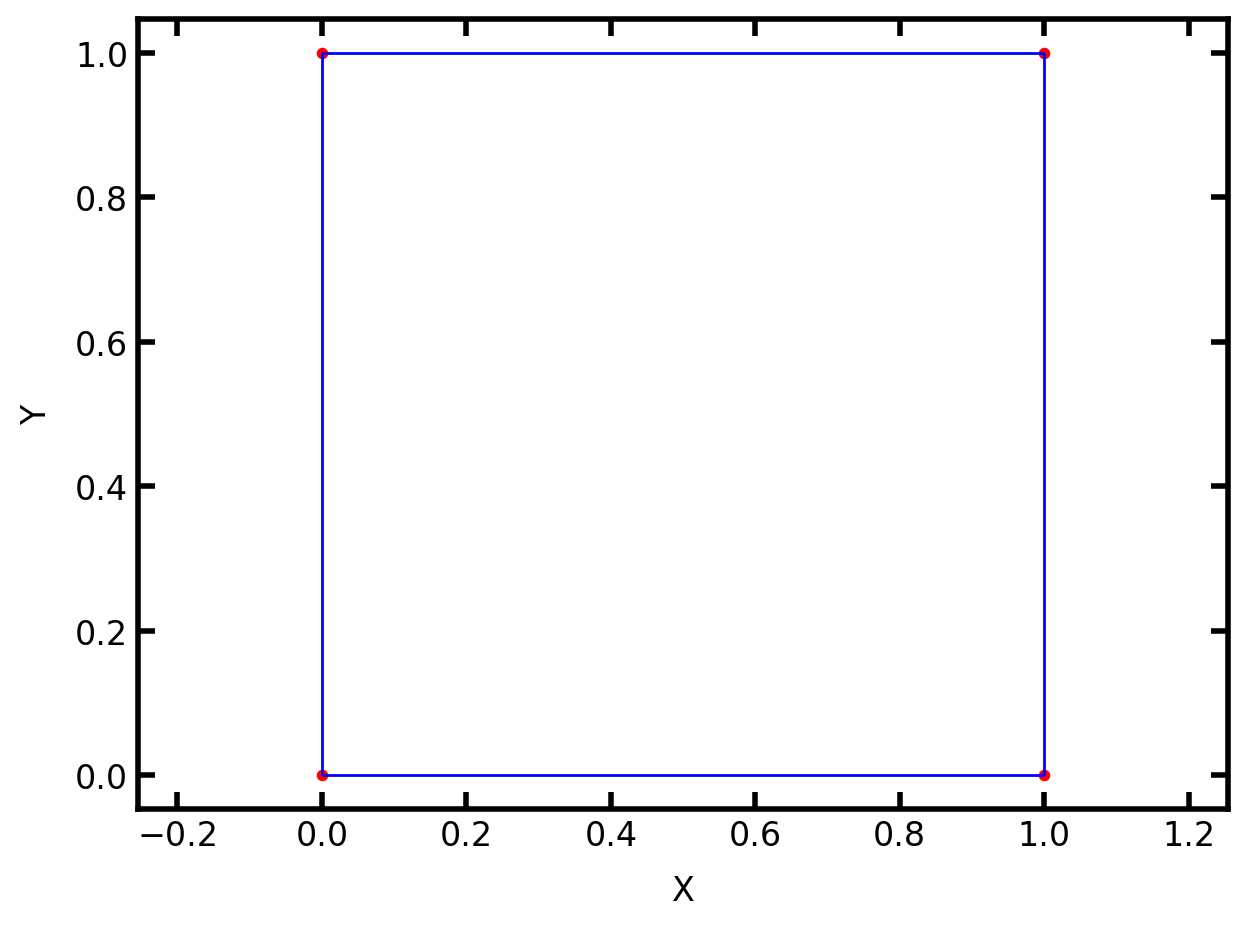
正如OpenPNM可以处理随机的Voronoi网络一样,它也可以处理从图像中提取的网络。基本思想是OpenPNM需要知道每个孔的[x,y,z]坐标,以及哪些孔连接到哪个孔。现在先简单试一下
coords = [[0, 0, 0],  # coordinates for pore 0
          [1, 0, 0],  # coordinates for pore 1
          [1, 1, 0],  # coordinates for pore 2
          [0, 1, 0]]  # coordinates for pore 3
conns = [[0, 1],  # throat 0 connects pores 0 and 1
         [1, 2],  # throat 1 connects pores 1 and 2
         [2, 3],  # throat 2 connects pores 2 and 3
         [0, 3]]  # throat 3 connects pores 0 and 3
Dpore = [1,  # diameter for pore 0
         2,  # diameter for pore 1
         1,  # diameter for pore 2
         3,]  # diameter for pore 3
Dthroat = [0.5,  # diameter for throat 0
           0.2,  # diameter for throat 1
           0.8,  # diameter for throat 2
           0.7]  # diameter for throat 3

pn = op.network.Network(coords=coords, conns=conns)
ax = op.visualization.plot_connections(pn)
ax = op.visualization.plot_coordinates(pn, ax=ax)
Definition : Network(f) Network(conns=None, coords=None, name='net')
This class contains the main functionality used by all networks.Parameters
settings:dataclass-like or dict, optional
User defined settings for the object to override defaults. Can be a dataclass-type object with settings stored as attributes or a python dicionary of key-value pairs. Settings are stored in the settings attribute of the object.name:str, optional
A unique name to assign to the object for easier identification. If not given one will be generated.coords:array_like (optional)
An Np-by-3 array of [x, y, z] coordinates for each poreconns:array_like (optional)
An Nt-by-2 array of [head, tail] connections between pores
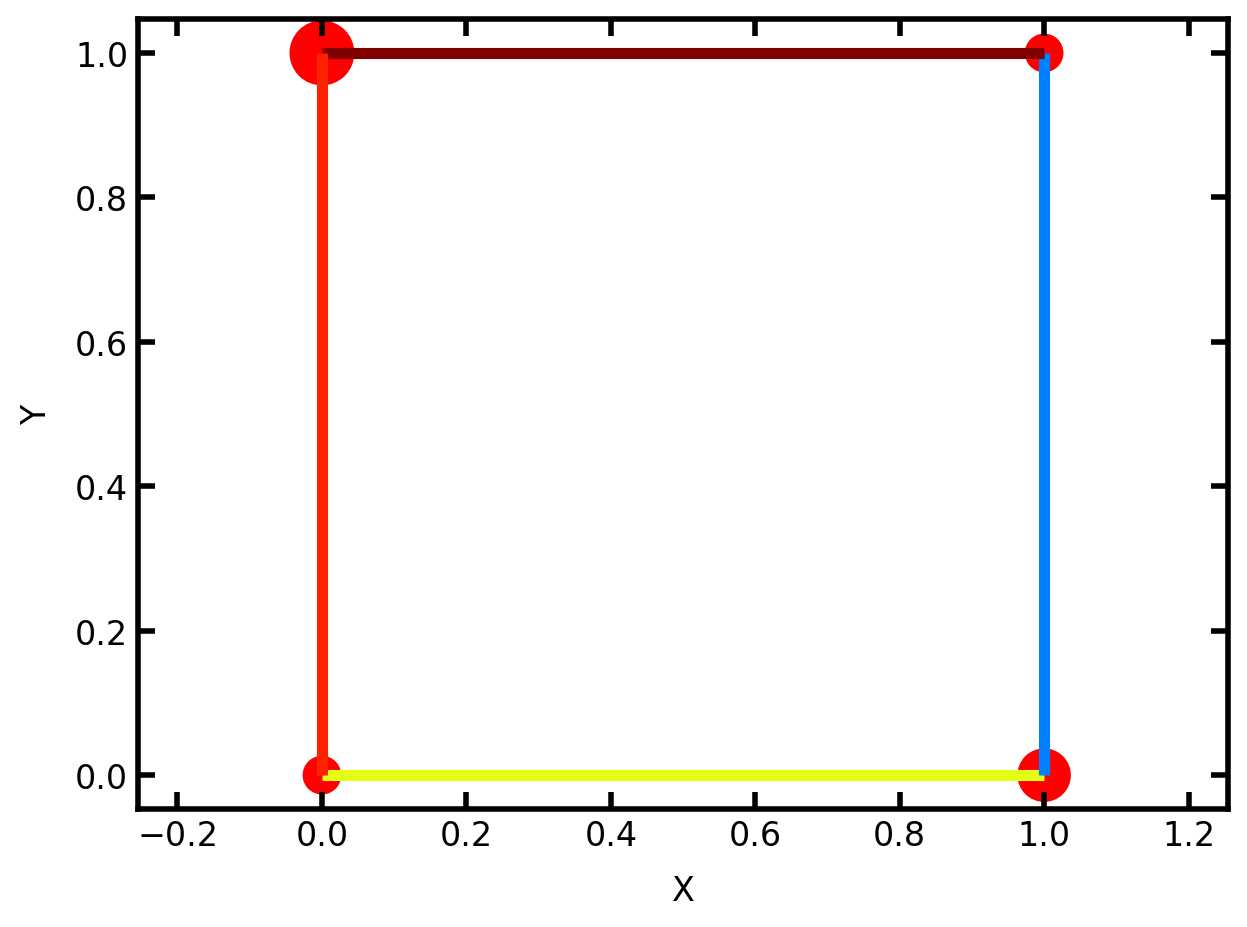
然后添加孔隙和流道的直径
pn['pore.diameter'] = Dpore
pn['throat.diameter'] = Dthroat
我们还可以调整图里的孔隙或者流道的尺寸以方便我们理解
ax = op.visualization.plot_connections(pn, color_by=pn['throat.diameter'], linewidth=4)
ax = op.visualization.plot_coordinates(pn, size_by=pn['pore.diameter'], markersize=500, ax=ax)
OpenPNM有一个模块 .io,可以从各种文件格式读取以及输出限的数量孔隙、流道信息,这个后面再说。
2.2 网络数据和拓扑的储存
OpenPNM 使用 Numpy 存储所有数据
OpenPNM 的所有对象都是子类化的 python 字典。
在本章中,将深入探讨 OpenPNM 数据存储方案的详细信息。要涵盖的部分包括:ndarraysdict
- The Spreadsheet Analogy
- Maintaining Data Integrity
- Representing Topology
2.2.1 Spreadsheet Analogy
OpenPNM中数据存储方式与电子表格类似,可以理解为OpenPNM所有数据存储在两个表中,一个用于储存孔隙数据,一个用于储存流道数据。每个孔隙(或流道)对应于一行,每个属性对应于一列。考虑以下具有 4 个孔隙、3 个流道的网络:
import openpnm as op
import numpy as np
op.visualization.set_mpl_style()
'''
Definition : set_mpl_style()
Prettifies matplotlib's output by adjusting fonts, markersize etc.
'''
np.random.seed(0)
pn = op.network.Demo(shape=[4, 1, 1])
'''
Definition : Demo(shape=[3, 3, 1], *, spacing=[1, 1, 1], connectivity=6, conns=None, coords=None, name='net')
A shortcut for generating a cubic network with geometrical properties already added.
'''
我们可以只用panda包来将几何信息表格化,并且可以提取所有维度为1的孔隙属性:
OpenPNM里的每个参数比如孔隙直径都是通过键值对储存在子类化的字典中的,孔隙直径为键(key),所有孔隙直径的数值组成的数组为值(value),ndim表示数组的维度,相关解释可以参考:https://blog.csdn.net/weixin_32767137/article/details/111950662
import pandas as pd
pore_data_sheet = pd.DataFrame({k: pn[k] for k in pn.props(element='pore') if pn[k].ndim == 1})
pore_data_sheet
Pandas 数据结构 - DataFrame
DataFrame 是一个表格型的数据结构,它含有一组有序的列,每列可以是不同的值类型(数值、字符串、布尔型值)。
DataFrame 既有行索引也有列索引,它可以被看做由 Series 组成的字典(共同用一个索引)。
关于DateFrame的相关解释参考:[Pandas.DataFrame](https://www.runoob.com/pandas/pandas-dataframe.html "Pandas.DataFrame")
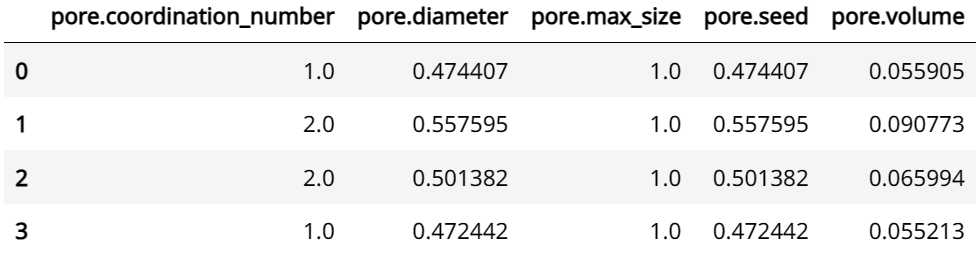
列名是 pore.volume 等属性,行对应于孔隙索引,因此 pore 0的体积为 0.055905。
还可以使用以下方法提取整个列:
column = pore_data_sheet['pore.volume']
print(column)
'''
0    0.055905
1    0.090773
2    0.065994
3    0.055213
Name: pore.volume, dtype: float64
'''

#或者查看单个元素
print(pore_data_sheet['pore.volume'][0])
'''
0.05590507143096387
'''
把OpenPNM的数据储存方式比作电子表格是非常贴切的,但是当考虑多个维度的数据(例如“pore.coords”)时,程序可能会崩溃。在字典中可以存储为 Np-by-3 数组,但电子表格通常要求所有数据仅1维度。
2.2.2 维护数据完整性的规则
这是通过子类化,OpenPNM 每次将数据分配给字典键时,首先检查数据类型和字典键,以确保遵循规则。
所有 values 都转换为 numpy 数组
只有 Numpy 数组可以存储在 OpenPNM 对象中,写入 OpenPNM 对象(即字典)的任何数据都将转换为 Numpy 数组。这样做是为了确保整个代码中的所有数学运算都可以使用矢量化一致地完成。
pn['throat.list'] = [1, 2, 3]
print(type(pn['throat.list']))
#
#这说明基本的python列表类型在存储在字典中时已转换为Numpy数组
字典键(key)必须以“pore”或“throat”开头
#字典键(key)必须以“pore”或“throat”开头,用于标识它们包含的信息类型。
try:
    pn['foo.bar'] = 0
except:
    print('This will throw an exception since the dict name cannot start with foo')
#This will throw an exception since the dict name cannot start with foo
前缀必须是“pore”或“throat”,以便 OpenPNM 知道数组应该有多长。写入错误长度的数组会报错:
try:
    pn['pore.test'] = [0, 0, 0]
except:
    print('This will throw an exception since there are 4 pores, hence all pore arrays should be 4 elements long')
#This will throw an exception since there are 4 pores, hence all pore arrays should be 4 elements long
任何标量都扩展为长度为Np或Nt向量
为了一致性,字典中只允许存在长度为Np或Nt的数组。根据数组的名称,将标量值分配给字典会OpenPNM会创建全长向量,长度为Np或Nt。这可以效地将标量值应用于网络中的所有位置。
pn['pore.test'] = 0
print(pn['pore.test'])
[0 0 0 0]
字典名是可以嵌套的
pn['pore.concentration'] = {'species_A': 0, 'species_B': 1}
print(pn['pore.concentration'])
'''
{'species_A': array([0, 0, 0, 0]), 'species_B': array([1, 1, 1, 1])}
上面关于将标量值扩展到 numpy 数组的规则已经应用。
'''
#可以直接访问字典键对应的值:
print(pn['pore.concentration.species_A'])
'''
[0 0 0 0]
'''
#也可以直接检索字典:
pn['pore.concentration']
pn['pore.concentration']['species_A']
'''
{'species_A': array([0, 0, 0, 0]), 'species_B': array([1, 1, 1, 1])}
array([0, 0, 0, 0])
'''
布尔数组视为标签,数值数组视为属性
任何布尔数据都将被视为标签,而所有其他数值数据则被视为属性。我们可以通过指定一个新的关键字来创建一个新标签。先查看pn的详情页
print(pn)
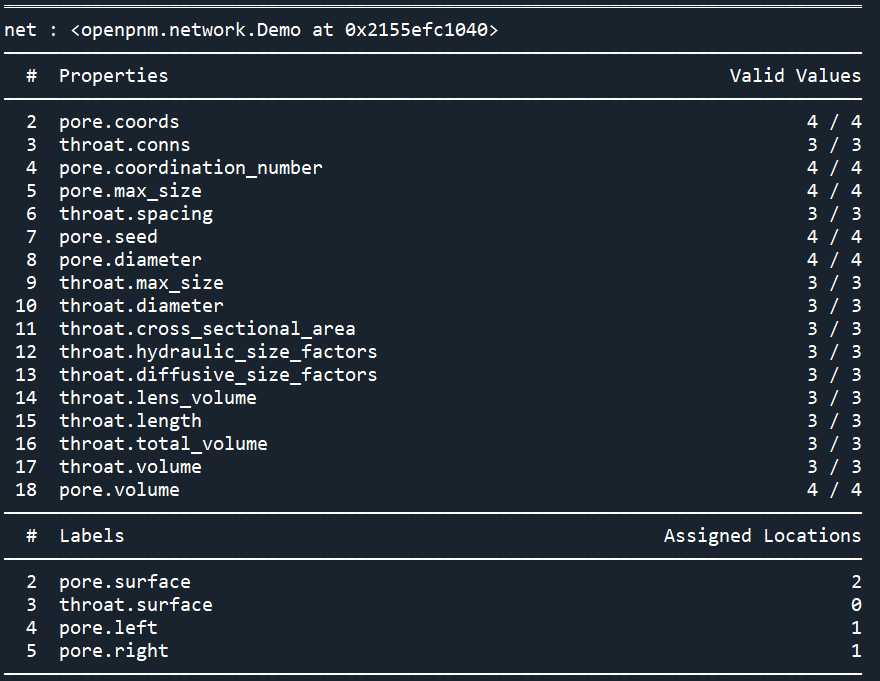
标签里只有四个标签,现在添加一个pore.label
pn['pore.label'] = False
print(pn['pore.label'])
print(pn.labels(element='pore'))
print(pn)
'''
[False False False False]
pn['pore.label']为四个元素全为False的一维数组,意思是网络模型里的四个孔隙都没有加上pore.label的标签
['pore.label', 'pore.left', 'pore.right', 'pore.surface']
'''
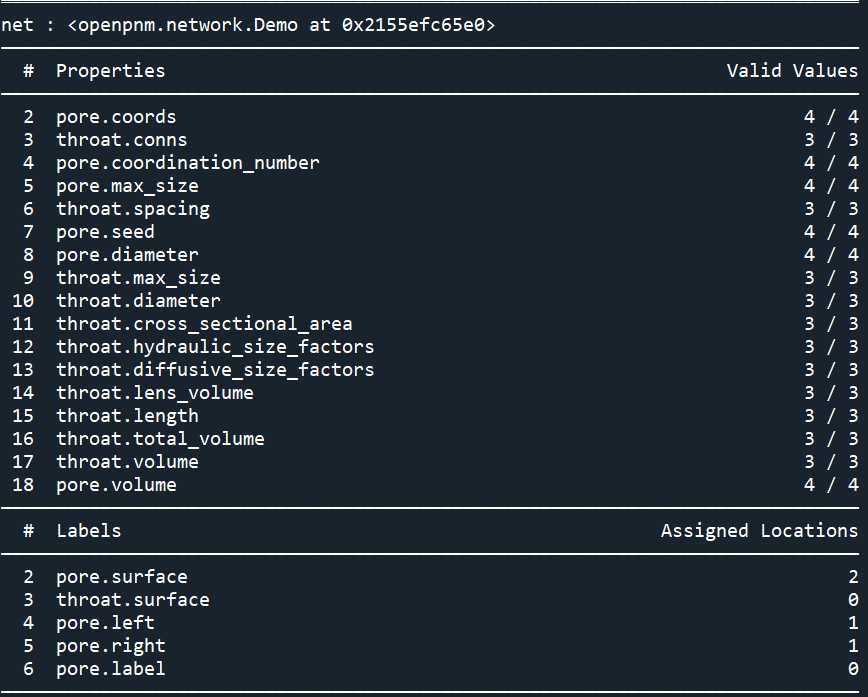
因为是布尔类型,所以可以看到标签里多了pore.label,pn['pore.label']为全为False的一维数组,但是,如果查询网络哪些孔隙具有该标签,答案是没有:
pn.pores('label')
array([], dtype=int64)
然后我们将某些编号的孔隙设置为Ture:
pn['pore.label'][[0, 1, 2]] = True #表示编号为0,1,2的孔隙添加上了pore.label的标签
print(pn.pores('label'))
#[0 1 2]
就可以发现编号0,1,2的孔隙被添加了pore.label标签
上述给指定编号的对象添加标签的程序可以一部完成:
pn.set_label('another', pores=[2, 3])
print(pn.pores('another'))
#[2 3]
带有前置下划线的字典键是隐藏的
如果一段数据并不真正打算被用户看到或使用,则可以在它前面加上下划线,并且不会出现在任何输出中。
pn['pore._hidden'] = 1
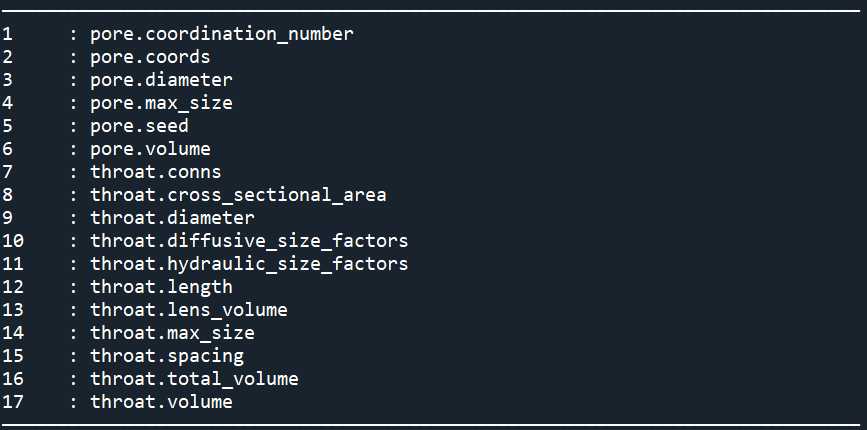
print(pn.props())
pn['pore._hidden']
#array([1, 1, 1, 1])
print('pore._hidden' in pn.keys())
#True
2.2.3 前缀param
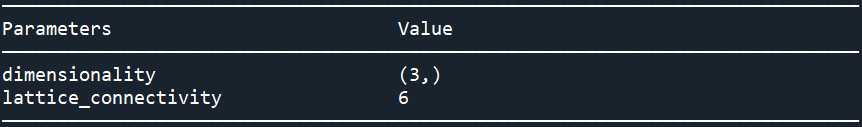
OpenPNM将所有标量值扩展为和Np或Nt一样长的数组是为了方便,这样就可以将参数X(key)的值(value)赋予给所有的孔隙,并且参数X在每个孔隙或者流道中可能具有不同的值。但是,有些特性是定值,例如分子量或临界温度。现在演示将定值属性引入所有对象pn.params
pn.params['lattice_connectivity'] = 6
print(pn.params)
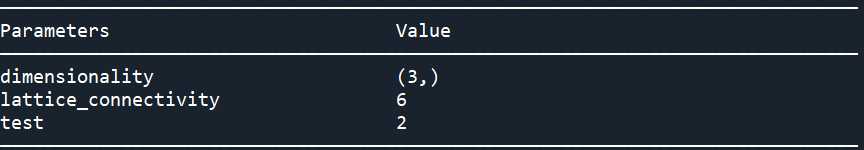
pn['param.test'] = 2
print(pn.params)
2.2.4 拓扑
以下简单的随机网络为例:
np.random.seed(0)
dn = op.network.Delaunay(points=4, shape=[1, 1, 0])
op.visualization.plot_tutorial(dn);
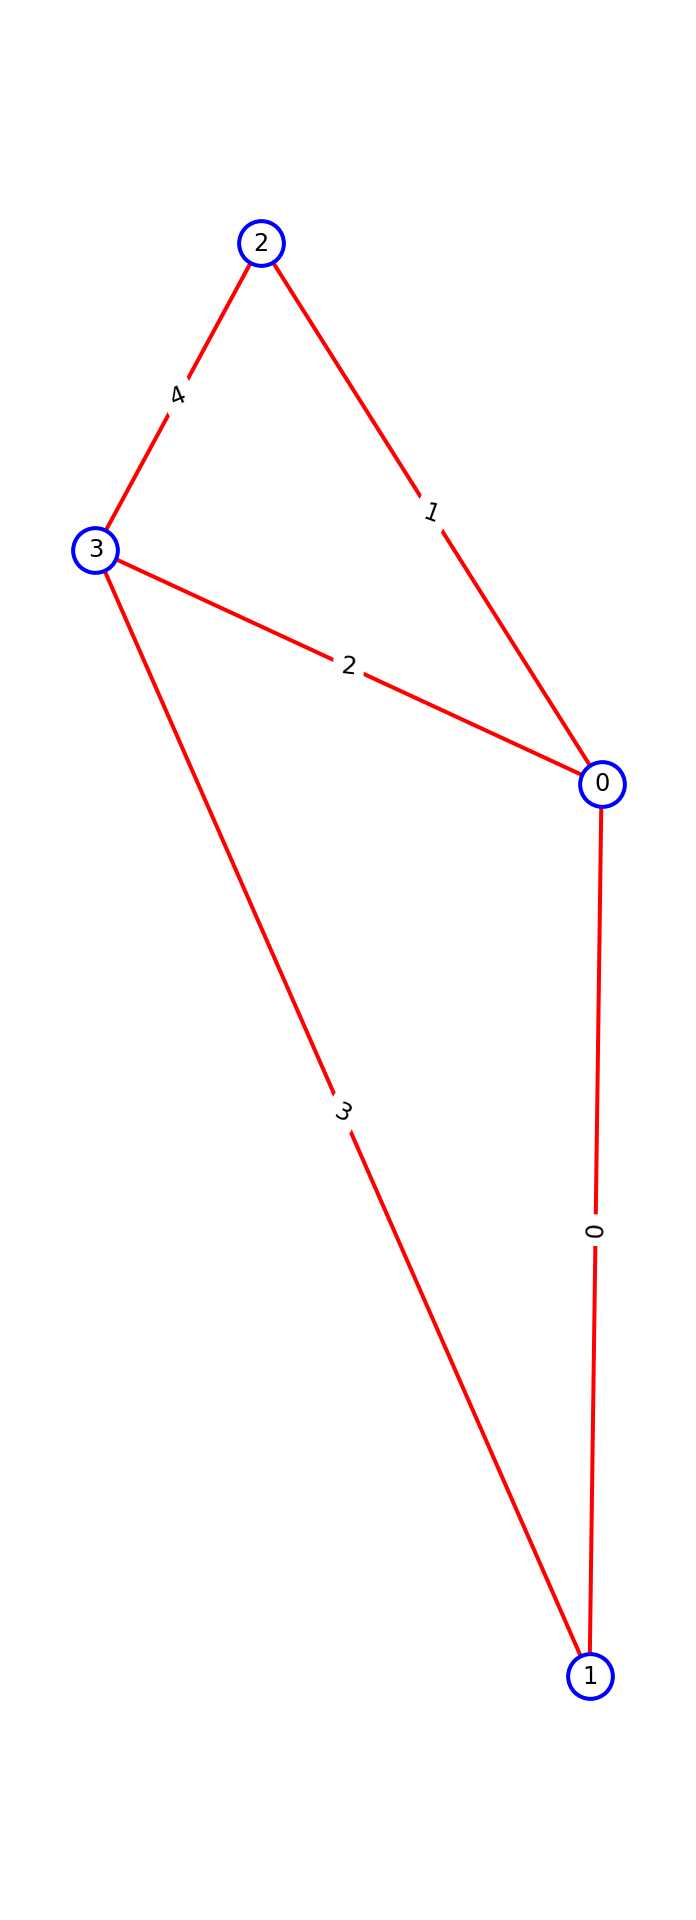
OpenPNM如何存储拓扑的基本前提可以用一句话来说明:
流道两端的孔隙以及其直径、长度等都是另一组需要储存的数据。
换句话说,参考上图,5号流道的末端有孔1和4。使用电子表格类比,这意味着一个新的列,用于存储由每个流道连接的孔隙对。 调用此属性:'throat.conns'
print(dn['throat.conns'])
'''
[[0 1]
 [0 2]
 [0 3]
 [1 3]
 [2 3]]
'''
检查此 Nt-by-2 数组显示,每行都包含对应于该流道的孔隙对索引
拓扑规则:OpenPNM 要求网络模型满足以下条件:
两个孔隙之间有且仅有一条流道来连接
流道是非定向的,这意味着任一方向的流动是相同的 其他一般但非必要的规则是:
孔隙可以有任意数量的流道,包括零;但是,流道为零会导致其他问题,应避免。
两个孔通常由不超过一个流道连接。在OpenPNM中,一对孔之间有多个流道在技术上是可以实现的,但可能会出现意想不到的结果。例如,当转换为CSR格式时,双流道合并为一个,因此重新转换回原格式会导致此类流道丢失。
2.2.5 conduit数据
OpenPNM中的conduit是指“孔-流道-孔”连接,其中孔和流道分别称为元素。这些元件串联起电阻(或导体)的作用。每个conduit恰好包含1个喉道和2个孔。网络内的传输是通过这些相互连接的管道进行的,因此这些元素的几何性质通常需要用于计算扩散等东西。这很常见,OpenPNM V3包含了一个新的helper函数来获取这些数据,如下所示:
D = pn.get_conduit_data('diameter')
print(D)
'''
[[0.47440675 0.23720338 0.55759468]
 [0.55759468 0.25069084 0.50138169]
 [0.50138169 0.2362208  0.47244159]]
'''
#上面的数组包含 3 列,中间列代表流道直径
print(pn['throat.diameter'])
'''
[0.23720338 0.25069084 0.2362208 ]
'''
#左右列代表流道两端孔的直径。“左”与“右”的顺序反映了数组的孔隙编号。'throat.conns'
print(pn.conns)
'''
[[0 1]
 [1 2]
 [2 3]]
'''
#孔的直径值可以使用numpy的索引获得
R1_R2 = pn['pore.diameter'][pn.conns]
print(R1_R2)
'''
[[0.47440675 0.55759468]
 [0.55759468 0.50138169]
 [0.50138169 0.47244159]]
'''
2.3 网络模型的显示、查询和操作
为了了解如何查询和操作网络,首先介绍网络的表达形式。具体来说,OpenPNM 使用邻接矩阵来表示拓扑,但偶尔会调用关联矩阵,因为这会使某些查询更容易。
import openpnm as op
import numpy as np
import matplotlib.pyplot as plt
op.visualization.set_mpl_style()
2.3.1 邻接矩阵
在OpenPNM中,基本的邻接矩阵是一个由 1 和 0 组成的 Np×Np 数组,其中位置的 1 表示孔隙之间是相连的。
邻接矩阵的逻辑结构分为两部分:V和E集合,其中,V是顶点,E是边。因此,用一个一维数组存放图中所有顶点数据;用一个二维数组存放顶点间关系(边或弧)的数据,这个二维数组称为邻接矩阵。邻接矩阵又分为有向图邻接矩阵和无向图邻接矩阵
先创建一个简单的网络,然后调用create_adjacency_matrix函数:
Definition : create_adjacency_matrix(weights=None, fmt='coo', triu=False, drop_zeros=False)
生成所需稀疏格式的加权邻接矩阵
参数:
weights:array_like,可选
一个数组,包含要输入矩阵的流道编号(在图论中,这些值被称为“权重”)。
如果阵列长Nt,则意味着矩阵是对称的,因此上三角形区域和下三角形区域是镜像。如果它是2*Nt长,则假设前Nt个元素用于上三角形,最后Nt个单元用于下三角形。
如果省略,则使用1来创建仅表示连通性的标准邻接矩阵。fmt:str,可选
要返回的稀疏存储格式。选项包括:
coo:这是OpenPNM数据的默认格式
lil:启用矩阵的逐行切片
csr:受大多数线性代数例程的青睐
dok:启用位置的下标访问triu:bool,默认为False
如果为True,则返回的稀疏矩阵仅包含上部三角形元素。如果权重数组的长度为2*Nt,则会忽略此参数。drop_zers:bool,默认为False
如果为True,则应用稀疏阵列的elimite_zeros方法来移除所有零位置。Returns:
指定Scipy稀疏格式的邻接矩阵。
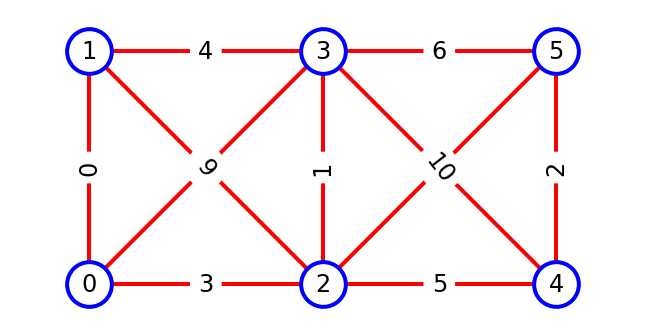
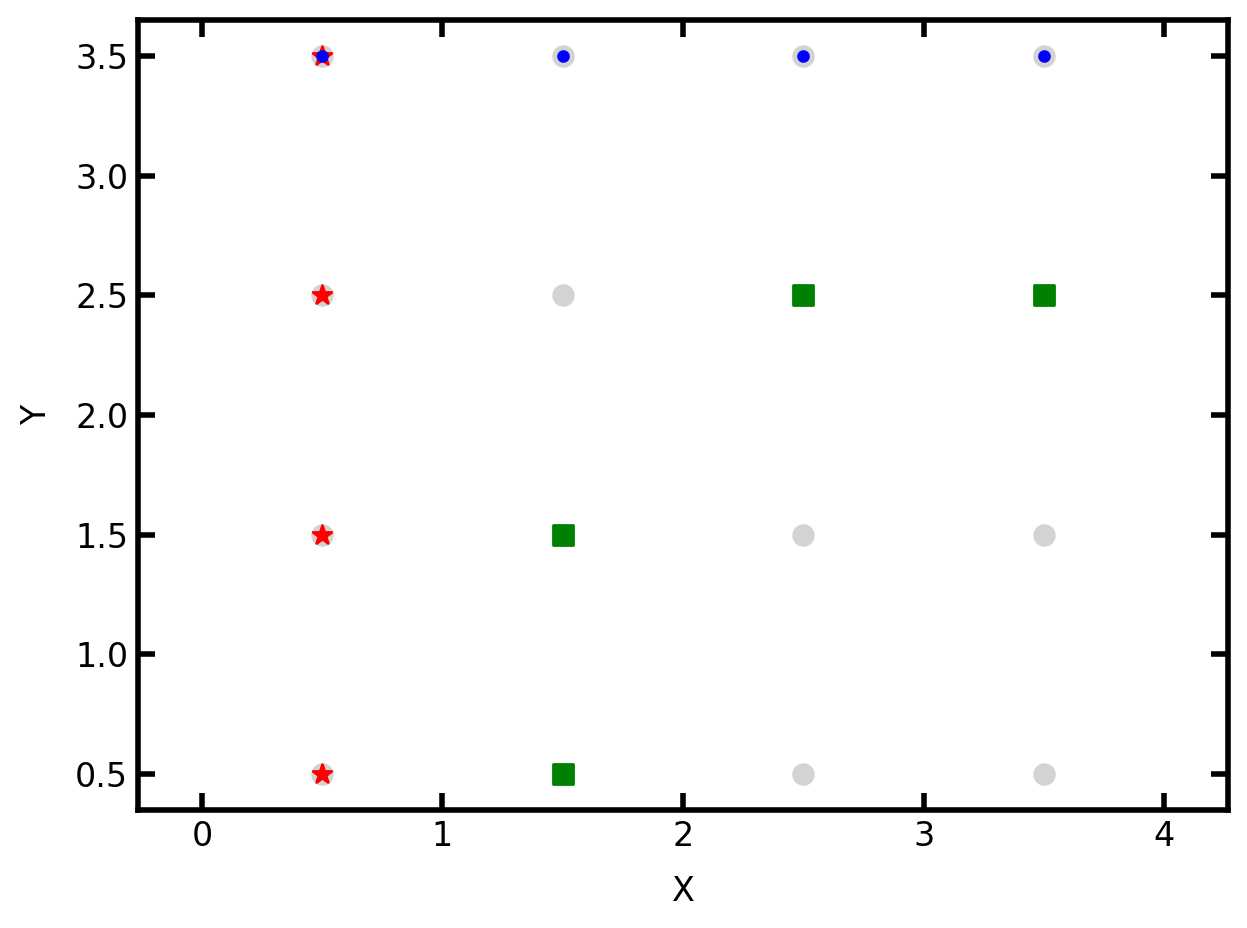
pn = op.network.Cubic(shape=[3, 2, 1], connectivity=26)
am = pn.create_adjacency_matrix().todense()
print(am)
'''
[[0 1 1 1 0 0]
 [1 0 1 1 0 0]
 [1 1 0 1 1 1]
 [1 1 1 0 1 1]
 [0 0 1 1 0 1]
 [0 0 1 1 1 0]]
 '''
在这个网络中共有6个孔隙,11条流道:
print(pn.pores())
print(pn.throats())
op.visualization.plot_tutorial(pn)
'''
[0 1 2 3 4 5]
[ 0  1  2  3  4  5  6  7  8  9 10]
'''
邻接矩阵可以这样理解:
矩阵的每一行每一列都代表一个孔,比如第一行和第一列是0号孔,第二行和第二列是1号孔,以此类推。矩阵第一行第一列的元素是0,表示0号孔和0号孔之间没有流道,矩阵第一行第二列的元素为1,表示0号孔和1号孔之间存在流道,以此类推,就可以从这个矩阵中看出哪两个孔是相连的。
2.3.1.1 邻接矩阵的默认稀疏格式
当我们开始考虑具有数百万个孔隙的网络时,这些孔隙的数据需要非常大的内存来存储一个主要是 0 的数组。矩阵中存在大量的0,那矩阵就应该用稀疏格式表示。最直观的稀疏存储方案是 COOrdinate 格式。由于矩阵是对称的,我们只需要存储上(或下)三角形部分:
am = pn.create_adjacency_matrix(triu=True)
print(am)
'''
  (0, 1)    1
  (2, 3)    1
  (4, 5)    1
  (0, 2)    1
  (1, 3)    1
  (2, 4)    1
  (3, 5)    1
  (0, 3)    1
  (2, 5)    1
  (1, 2)    1
  (3, 4)    1
'''
前两列是相连的两个孔的编号。第三列是存储在矩阵中的值,在标准邻接矩阵中为 1。孔 0 和 1 由流道 0 连接,孔 2 和 3 由流道 1 连接,依此类推。将流道索引放入邻接矩阵中得到:
am = pn.create_adjacency_matrix(weights=pn.Ts, triu=True)
print(am)
'''
  (0, 1)    0
  (2, 3)    1
  (4, 5)    2
  (0, 2)    3
  (1, 3)    4
  (2, 4)    5
  (3, 5)    6
  (0, 3)    7
  (2, 5)    8
  (1, 2)    9
  (3, 4)    10
'''
2.3.1.2 其他稀疏格式
上述 COO 格式是 OpenPNM 数据存储的默认格式;但是,它不太适合执行查询任务,例如哪些孔 0 和那些孔相连。实际上,唯一可以直接用COO格式执行的查询就是找出哪两个孔通过流道连接。幸运的是,我们还可以使用其他几种稀疏格式。“lil”格式非常有用。
#查询孔 i 和那些孔相连
am = pn.create_adjacency_matrix(weights=pn.Ts, fmt='lil', triu=False)
for locations_of_nonzeros in am.rows:
    print(locations_of_nonzeros)
'''
[1, 2, 3]
[0, 2, 3]
[0, 1, 3, 4, 5]
[0, 1, 2, 4, 5]
[2, 3, 5]
[2, 3, 4]
'''
0 [1, 2, 3] ——0号孔和1,2,3号孔相连
1 [0, 2, 3] ——1号孔和0,2,3号孔相连
2 [0, 1, 3, 4, 5] ——2号孔和0, 1, 3, 4, 5号孔相连
3 [0, 1, 2, 4, 5] ——3号孔和0, 1, 2, 4, 5号孔相连
4 [2, 3, 5] ——4号孔和2, 3, 5号孔相连
5 [2, 3, 4] ——5号孔和2, 3, 4号孔相连
或者我们也可以查询孔 i 和那些流道相连
for values_of_nonzeros in am.data:
    print(values_of_nonzeros)
'''
[0, 3, 7]
[0, 9, 4]
[3, 9, 1, 5, 8]
[7, 4, 1, 10, 6]
[5, 10, 2]
[8, 6, 2]
'''
其他类型的稀疏格式可以参考:
https://zhuanlan.zhihu.com/p/188700729
2.3.1.3 关联矩阵
关联矩阵可以告诉我们哪个孔连接到哪个流道。换句话说,它是一个 Np-by-Nt 数组,位置处有一个非零值,表示孔连接到流道。
im = pn.create_incidence_matrix().todense()
print(im)
'''
[[1 0 0 1 0 0 0 1 0 0 0]
 [1 0 0 0 1 0 0 0 0 1 0]
 [0 1 0 1 0 1 0 0 1 1 0]
 [0 1 0 0 1 0 1 1 0 0 1]
 [0 0 1 0 0 1 0 0 0 0 1]
 [0 0 1 0 0 0 1 0 1 0 0]]
'''
2.3.2 OpenPNM的查询操作
上面的介绍旨在提供一些有关如何在“幕后”执行查询操作的背景知识,但直接使用这些代码不是很方便。OpenPNM 中包含了比较简单的方法:
pn = op.network.Cubic(shape=[4, 4, 1])
#查找特定标签的孔或者流道信息
P_left = pn.pores('left')
P_bottom = pn.pores('back')
print(P_left)
print(P_bottom)
'''
[0 1 2 3]
[ 3  7 11 15]
'''
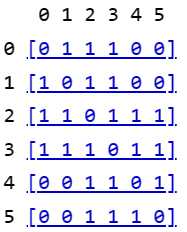
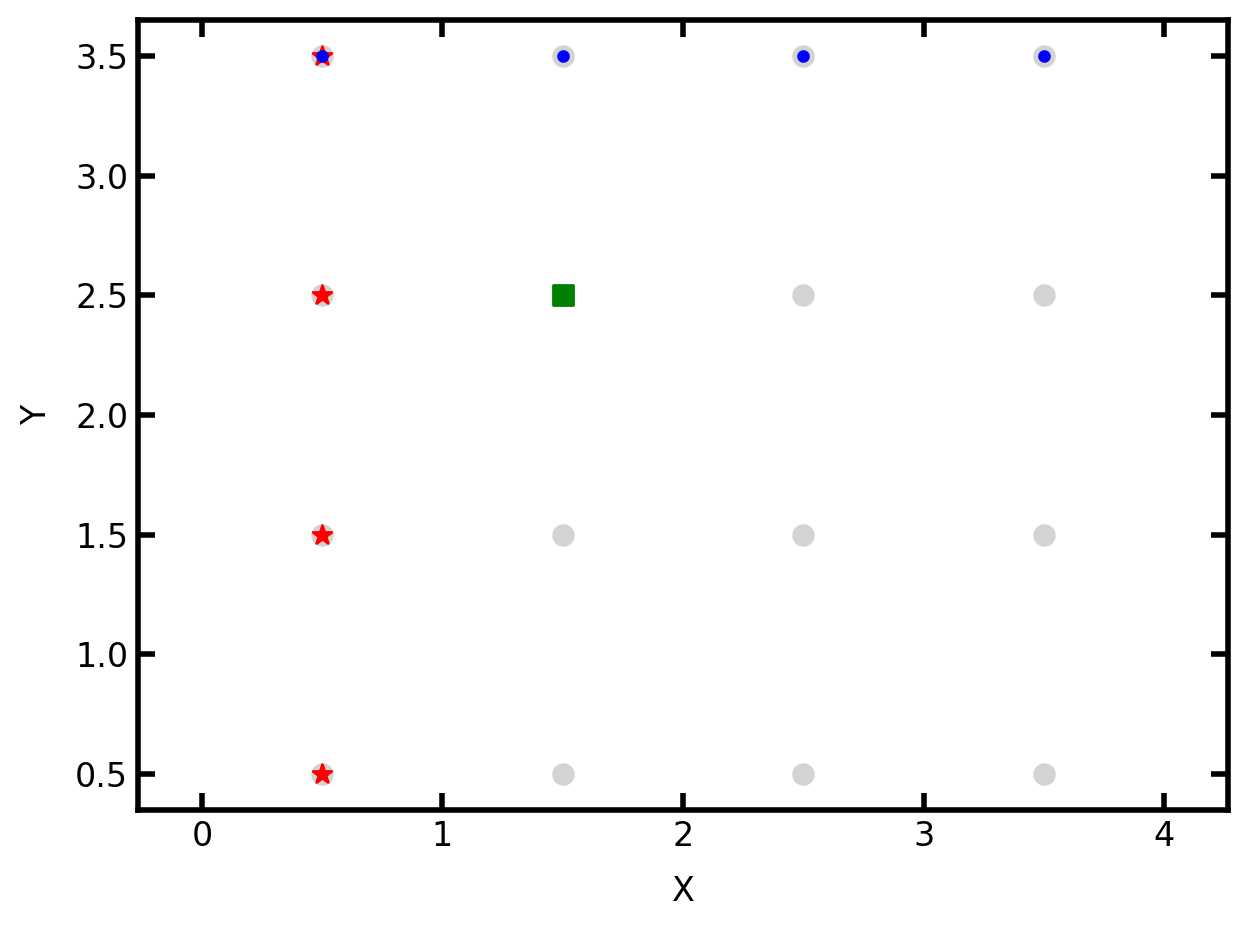
2.3.2.1 查询网络中孔的相关信息
比如有两组孔,如下图所示
fig, ax = plt.subplots()
op.visualization.plot_coordinates(pn, pn.Ps, c='lightgrey',
                                  markersize=50, ax=ax)
op.visualization.plot_coordinates(pn, P_left, c='red', marker='*',
                                  markersize=50, ax=ax)
op.visualization.plot_coordinates(pn, P_bottom, c='blue', marker='.',
                                  markersize=50, ax=ax);
有关fig, ax = plt.subplots()的解释可以参考:https://matplotlib.org/stable/api/_as_gen/matplotlib.pyplot.subplots.html
如果想要查询有那些孔连了一个或者多个流道,可以使用find函数:
Ps = pn.pores(['left', 'back'])
print(Ps)
Ps = pn.find_neighbor_pores(pores=Ps, mode='or')
print(Ps)
'''
[ 0  1  2  3  7 11 15]
[ 4  5  6 10 14]
'''
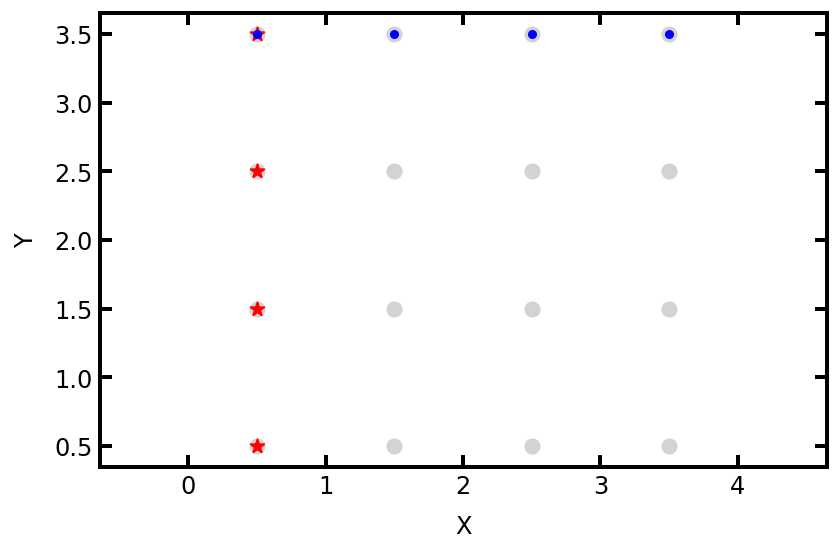
mode='or'查找与输入孔之间存在流道的其他所有孔
给定一组孔隙,找到与其中一个或多个相连的孔,称为OR
fig, ax = plt.subplots()
op.visualization.plot_coordinates(pn, pn.Ps, c='lightgrey',
                                  markersize=50, ax=ax)
op.visualization.plot_coordinates(pn, P_left, c='red',
                                  markersize=50, marker='*', ax=ax)
op.visualization.plot_coordinates(pn, P_bottom, c='blue',
                                  markersize=50, marker='.', ax=ax)
op.visualization.plot_coordinates(pn, Ps, c='green',
                                  markersize=50, marker='s', ax=ax);
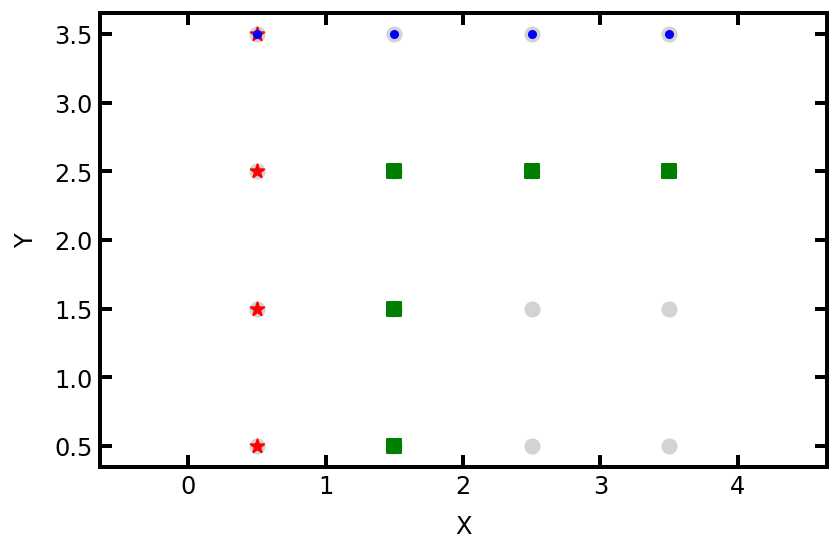
'mode='xor' 查找只与输入孔隙列表中的一个孔相连的其他所有孔孔隙
Ps = pn.pores(['left', 'back'])
print(Ps)
Ps = pn.find_neighbor_pores (pores=Ps, mode='xor')
print(Ps)
'''
[ 0  1  2  3  7 11 15]
[ 4  5 10 14]
'''
fig, ax = plt.subplots()
op.visualization.plot_coordinates(pn, pn.Ps, c='lightgrey',
                                  markersize=50, ax=ax)
op.visualization.plot_coordinates(pn, P_left, c='red',
                                  markersize=50, marker='*', ax=ax)
op.visualization.plot_coordinates(pn, P_bottom, c='blue',
                                  markersize=50, marker='.', ax=ax)
op.visualization.plot_coordinates(pn, Ps, c='green',
                                  markersize=50, marker='s', ax=ax);
mode='xnor'查找与输入孔隙列表中的 2 个或更多孔隙连接的其他所有孔
Ps = pn.pores(['left', 'back'])
print(Ps)
Ps = pn.find_neighbor_pores(pores=Ps, mode='xnor')
print(Ps)
'''
[ 0  1  2  3  7 11 15]
[6]
'''
fig, ax = plt.subplots()
op.visualization.plot_coordinates(pn, pn.Ps, c='lightgrey',
                                  markersize=50, ax=ax)
op.visualization.plot_coordinates(pn, P_left, c='red',
                                  markersize=50, marker='*', ax=ax)
op.visualization.plot_coordinates(pn, P_bottom, c='blue',
                                  markersize=50, marker='.', ax=ax)
op.visualization.plot_coordinates(pn, Ps, c='green',
                                  markersize=50, marker='s', ax=ax);
2.3.2.2 查找与指定孔隙相连的流道
与查找与孔相连的其他孔的逻辑一样:
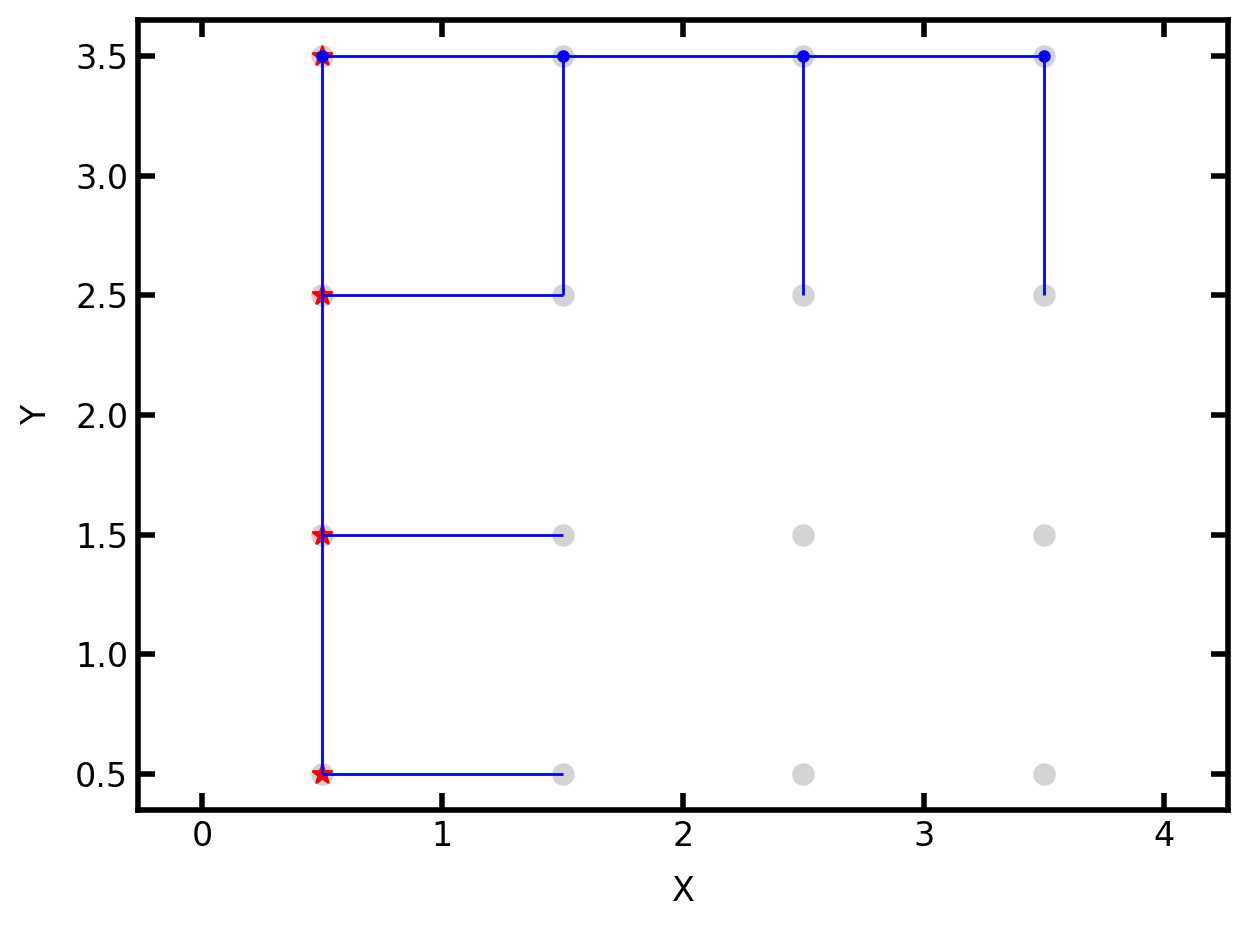
mode='or':
Ps = pn.pores(['left', 'back'])
Ts = pn.find_neighbor_throats(pores=Ps, mode='or')
fig, ax = plt.subplots()
op.visualization.plot_connections(pn, Ts, ax=ax)
op.visualization.plot_coordinates(pn, pn.Ps, c='lightgrey',
                                  markersize=50, ax=ax)
op.visualization.plot_coordinates(pn, P_left, c='red',
                                  markersize=50, marker='*', ax=ax)
op.visualization.plot_coordinates(pn, P_bottom, c='blue',
                                  markersize=50, marker='.', ax=ax);
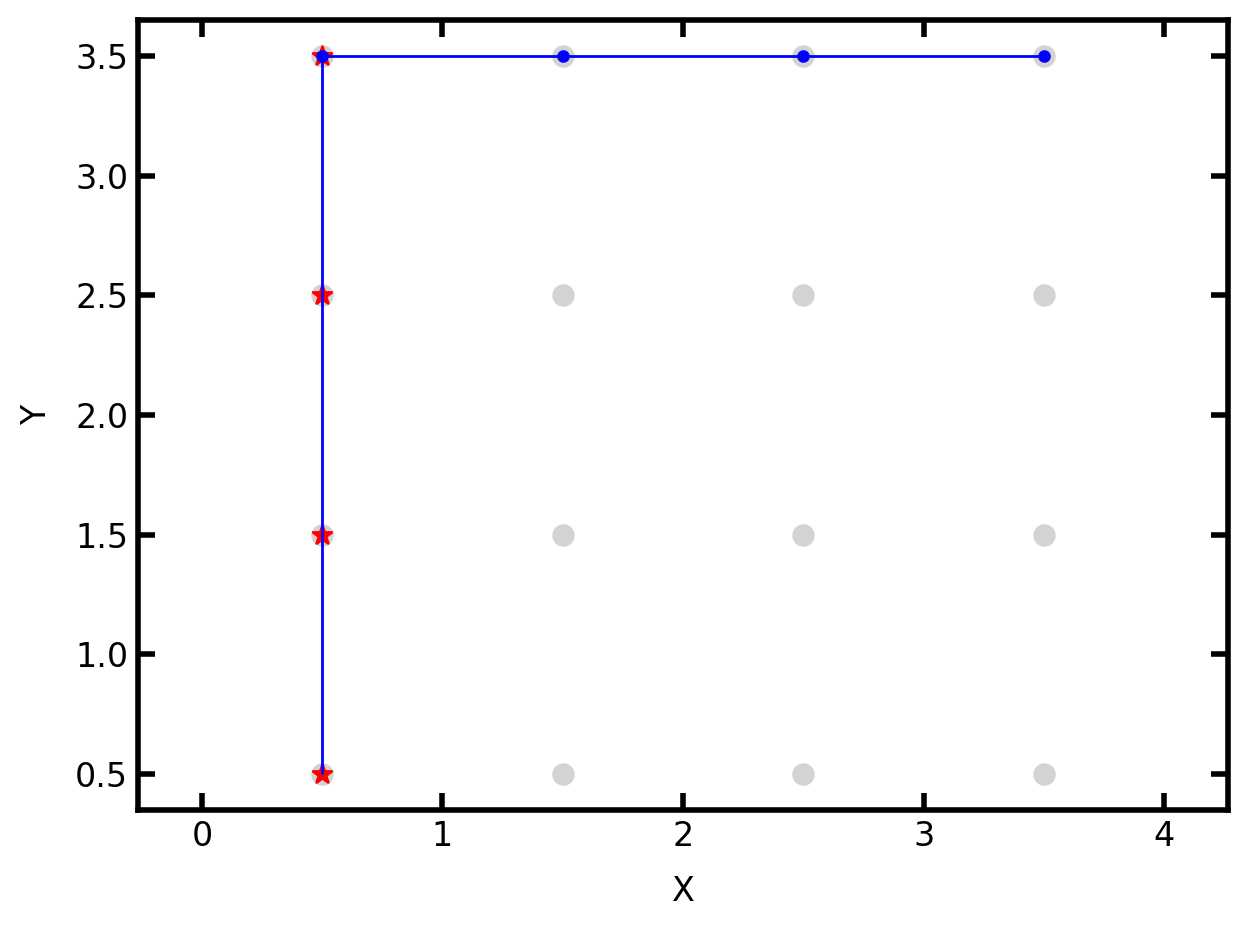
'mode='xnor' 仅查找输入孔之间的流道
Ps = pn.pores(['left', 'back'])
Ts = pn.find_neighbor_throats(pores=Ps, mode='xnor')
fig, ax = plt.subplots()
op.visualization.plot_connections(pn, Ts, ax=ax)
op.visualization.plot_coordinates(pn, pn.Ps, c='lightgrey',
                                  markersize=50, ax=ax)
op.visualization.plot_coordinates(pn, P_left, c='red',
                                  markersize=50, marker='*', ax=ax)
op.visualization.plot_coordinates(pn, P_bottom, c='blue',
                                  markersize=50, marker='.', ax=ax);
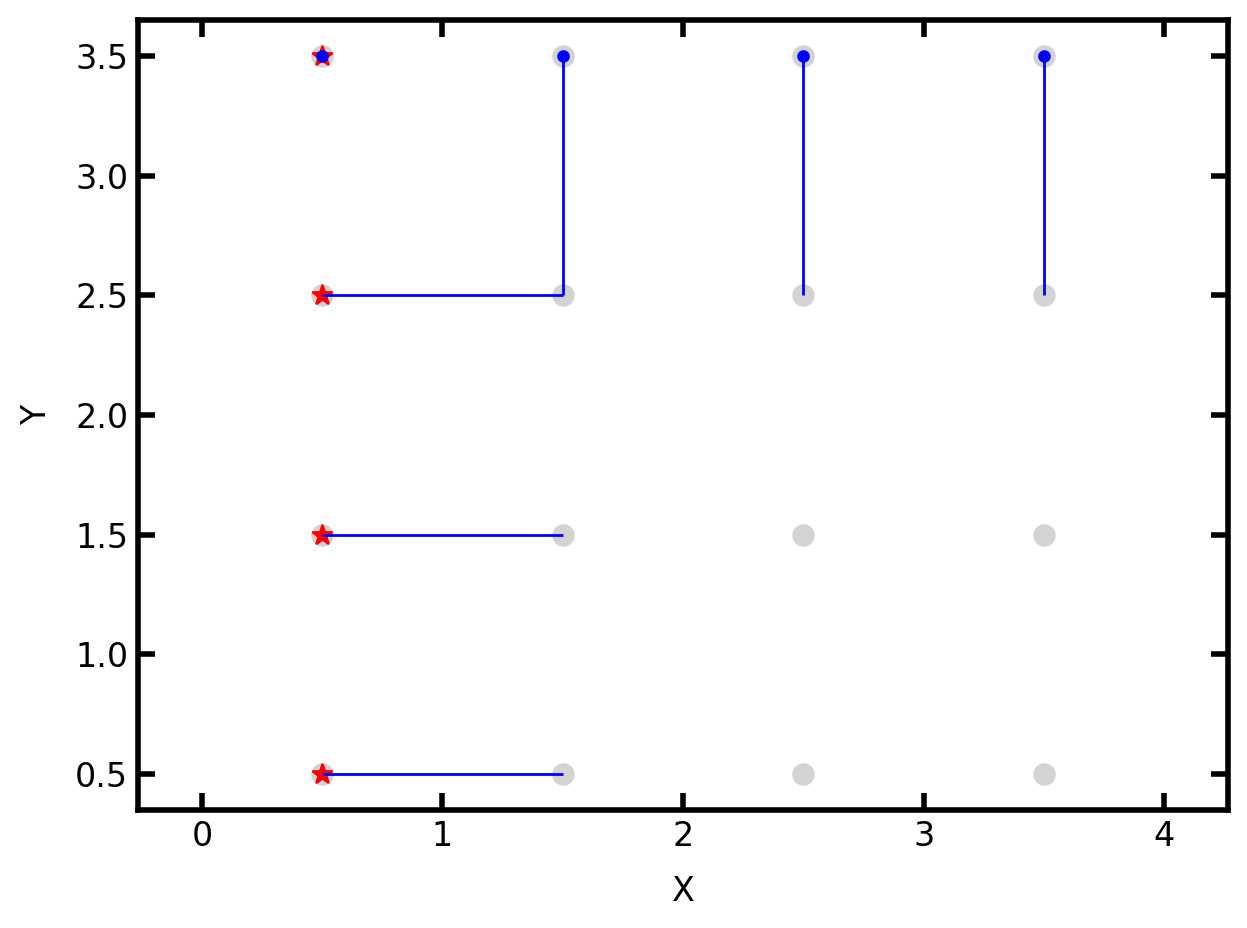
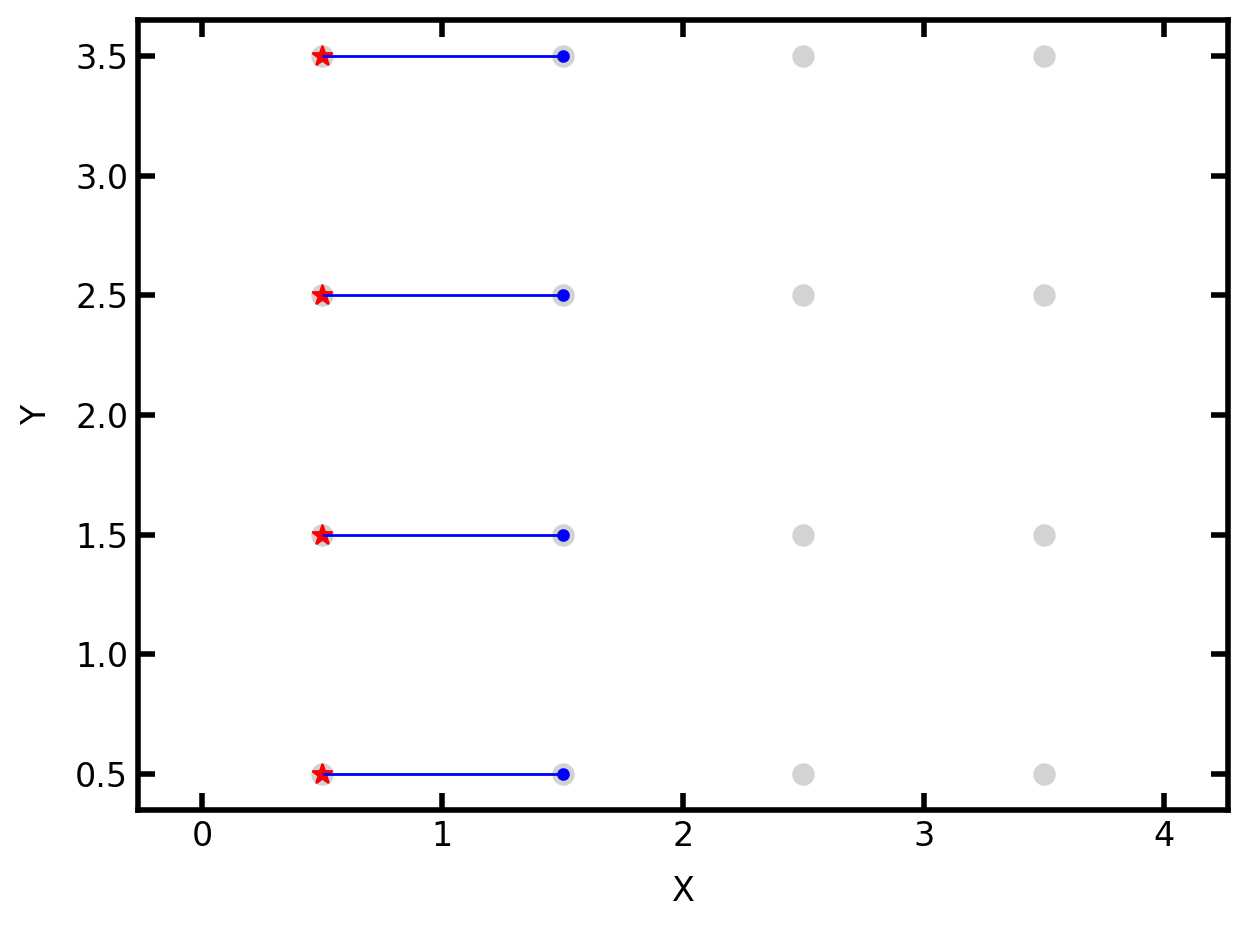
mode=xor查找仅与输入孔中一个孔相连的流道
Ps = pn.pores(['left', 'back'])
Ts = pn.find_neighbor_throats(pores=Ps, mode='xor')
fig, ax = plt.subplots()
op.visualization.plot_connections(pn, Ts, ax=ax)
op.visualization.plot_coordinates(pn, pn.Ps, c='lightgrey',
                                  markersize=50, ax=ax)
op.visualization.plot_coordinates(pn, P_left, c='red',
                                  markersize=50, marker='*', ax=ax)
op.visualization.plot_coordinates(pn, P_bottom, c='blue',
                                  markersize=50, marker='.', ax=ax);
查找给定两组孔隙之间的流道
find_connecting_throats
P1 = [0, 1, 2, 3]
P2 = [4, 5, 6, 7]
Ts = pn.find_connecting_throat(P1, P2)
print(Ts)
#[12 13 14 15]
fig, ax = plt.subplots()
op.visualization.plot_connections(pn, Ts, ax=ax)
op.visualization.plot_coordinates(pn, pn.Ps, c='lightgrey',
                                  markersize=50, ax=ax)
op.visualization.plot_coordinates(pn, P1, c='red',
                                  markersize=50, marker='*', ax=ax)
op.visualization.plot_coordinates(pn, P2, c='blue',
                                  markersize=50, marker='.', ax=ax);
如果两组孔之间没有流道连接则显示nan
P1 = [0, 1, 2, 3]
P2 = [7, 7, 7, 7]
Ts = pn.find_connecting_throat(P1, P2)
print(Ts)
#[nan nan nan 15.]
给定流道的索引,查找流道两端孔隙的索引
find_connected_porespn['throat.conns']
Ps = pn.find_connected_pores(throats=[0, 1, 2])
print(Ps)
'''
[[0 1]
 [1 2]
 [2 3]]
'''
Ps = pn['throat.conns'][[0, 1, 2]]
print(Ps)
'''
[[0 1]
 [1 2]
 [2 3]]
'''

#通常有一些孔隙编号是重复项。这可以通过以下方式消除:np.unique
print(np.unique(Ps))
'''
[0 1 2 3]
'''

#该方法有一个执行相同操作的参数:find_connected_poresflatten
Ps = pn.find_connected_pores(throats=[0, 1, 2], flatten=True)
print(Ps)
'''
[0 1 2 3]
'''
2.3.3 删除操作
删除流道
pn = op.network.Cubic(shape=[3, 2, 1])
print(pn)
print(pn.Ts)
'''
[0,1,2,3,4,5,6]
'''
我们可以看到只有两个数组包含流道数据,假设我们需要从中删除0号和3号流道。最简单的方法实际上是保留我们想要的:
mask = np.ones(pn.Nt, dtype=bool)
mask[[0, 3]] = False
pn['throat.conns'] = pn['throat.conns'][mask]
pn['throat.surface'] = pn['throat.surface'][mask]
print(pn)
print(pn.Ts)
'''
[0,1,2,3,4]
在删除操作完成后流道编号重新编排
'''
最简单的方法是通过 trim 函数删除网络里的流道或者孔隙:
Definition : trim(network, pores=[], throats=[])
Remove pores or throats from the networkParameters
networkNetwork
The Network from which pores or throats should be removed
pores (or throats)array_like
The indices of the of the pores or throats to be removed from the network.
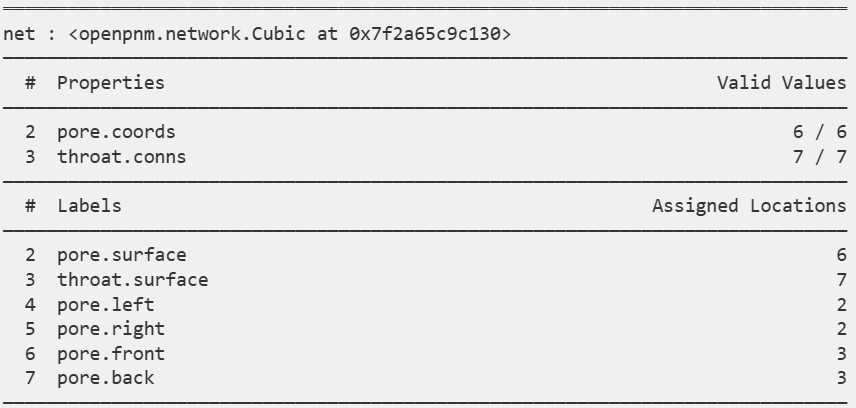
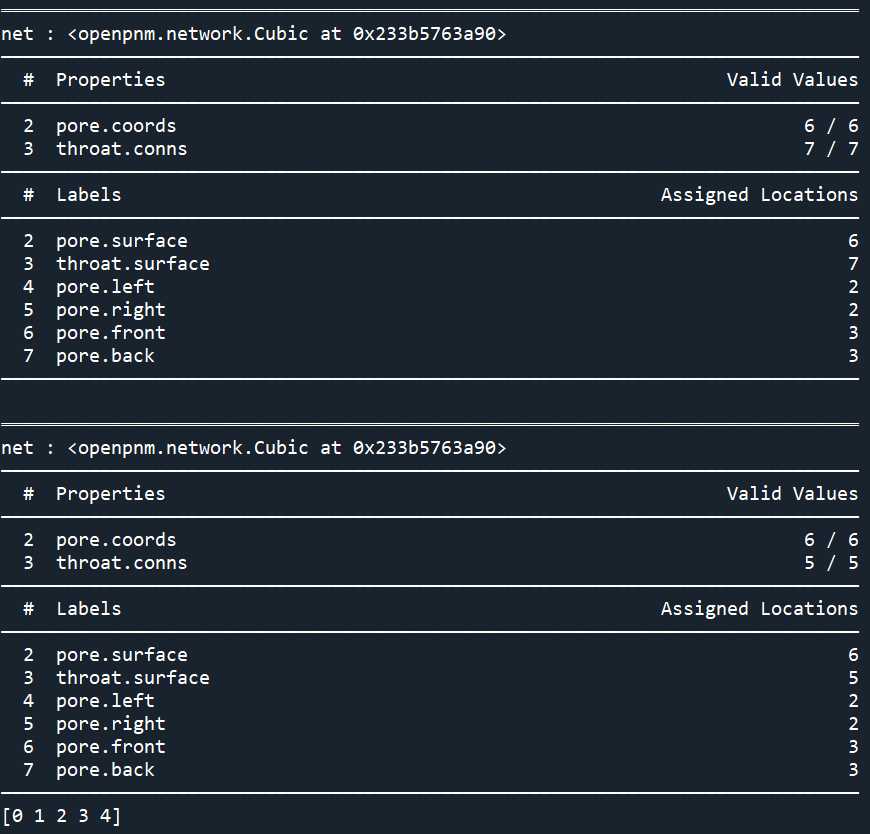
pn = op.network.Cubic(shape=[3, 2, 1])
print(pn)
op.topotools.trim(network=pn, throats=[0, 3])
print(pn)
print(pn.Ts)
删除孔
最简单的方法就是直接使用:trim函数
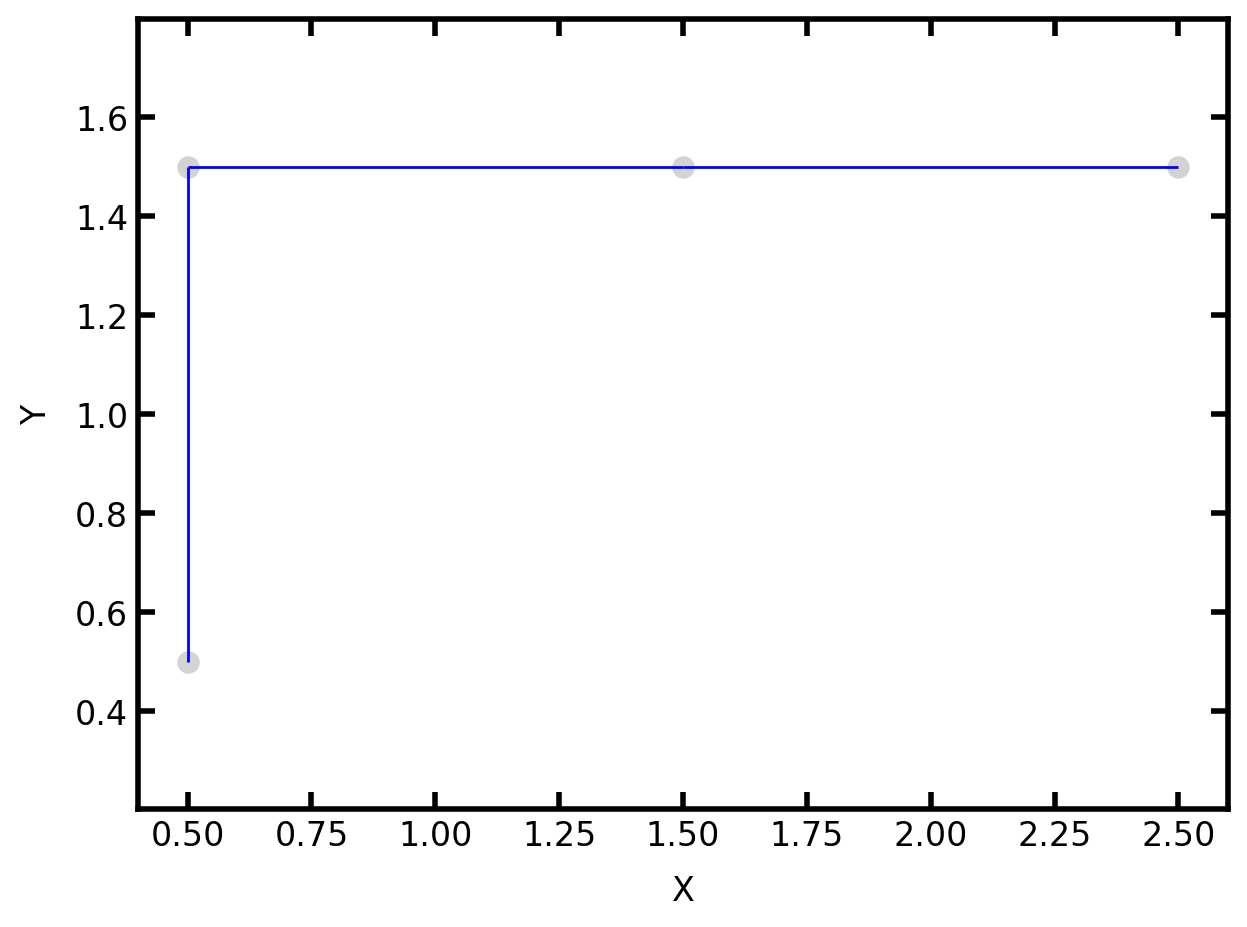
pn = op.network.Cubic(shape=[3, 2, 1])
op.topotools.trim(network=pn, pores=[2, 4])
fig, ax = plt.subplots()
op.visualization.plot_coordinates(pn, c='lightgrey',
                                  markersize=50, ax=ax)
op.visualization.plot_connections(pn, ax=ax);
2.3.4 增加孔或者流道的操作
采用extend函数来执行增加操作
Definition : extend(network, coords=[], conns=[], labels=[], **kwargs)
Add pores or throats to the network from a list of coords or conns.Parameters
network:Network
The network to which pores or throats should be addedcoords:array_like
The coordinates of the pores to add. These will be appended to the 'pore.coords' array so should be of shape N-by-3, where N is the number of pores in the list.conns:array_like
The throat connections to add. These will be appended to the 'throat.conns' array so should be of shape N-by-2. Note that the numbering must point to existing pores.labels:str, or list[str], optional
A list of labels to apply to the new pores and throats
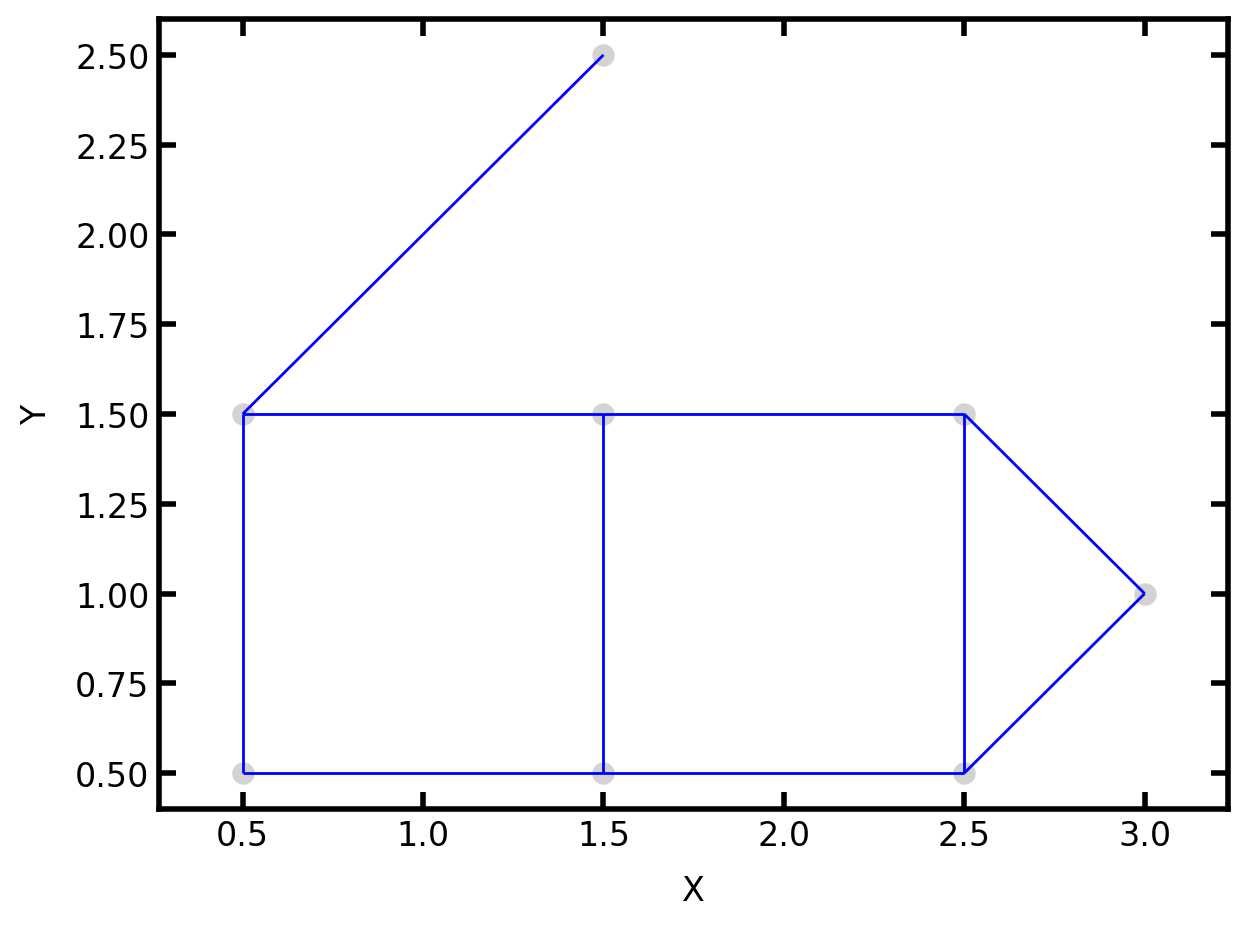
pn = op.network.Cubic(shape=[3, 2, 1])
new_pores = [[1.5, 2.5, 0.5], [3, 1, 0.5]]
new_conns = [[1, 6], [4, 7], [5, 7]]
op.topotools.extend(network=pn, coords=new_pores)
op.topotools.extend(network=pn, conns=new_conns)
fig, ax = plt.subplots()
op.visualization.plot_coordinates(pn, c='lightgrey',
                                  markersize=50, ax=ax)
op.visualization.plot_connections(pn, ax=ax);
Comments NOTHING