1. Fundamental concepts in statistics
Frequency Distribution
A frequency distribution is a listing of the possible values for a variable, together with the number, proportion, or percentage of observations at each value. A frequency distribution that has two distinct peaks is called bimodal.
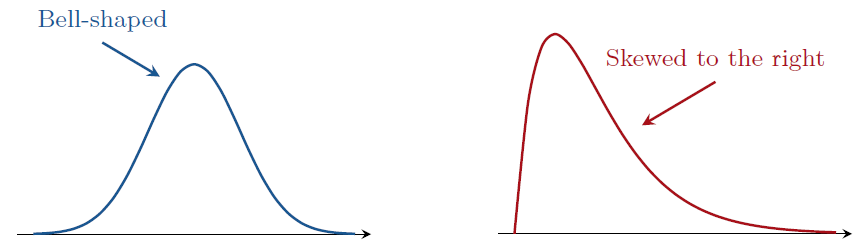
Histogram Graphic: A graph of the frequency distribution of a continuous variable or a discrete variable with intervals of values is called a histogram.
The shape of a histogram is informative.
Describing Data Variability: Standard Deviation and Variance
variability about that center (mean or median)
- The difference between the largest and smallest observations is called the range.
- deviation of observation $i$ of $y_i$: distances of all the observations from the center (a.k.a. mean or the center of gravity) is $(y_i - \overline{y})$.
-
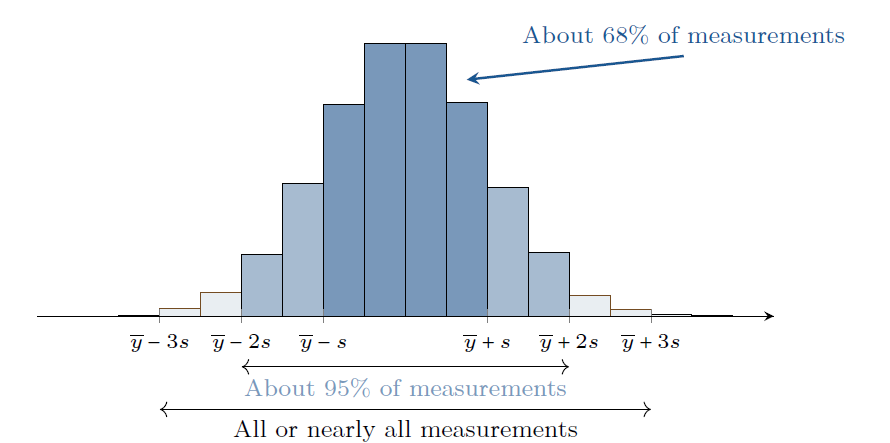
Standard deviation: For a variable $y$ with $ n $ observations $y_{1}$, $y_{2}$, $\ldots$, $y_{n}$ in a sample from some population, the standard deviation $ s $ is
$$
s=\sqrt{\frac{\sum_{i=1}^{n}\left(y_{i}-\bar{y}\right)^{2}}{n-1}}=\sqrt{\frac{\left(y_{1}-\bar{y}\right)^{2}+\left(y_{2}-\bar{y}\right)^{2}+\cdots+\left(y_{n}-\bar{y}\right)^{2}}{n-1}} .
$$
The standard deviation is the positive square root of the variance $ s^{2} $.
- Variance
$$
s^{2}=\frac{\sum_{i=1}^{n}\left(y_{i}-\bar{y}\right)^{2}}{n-1}
$$
Describing Position: Percentiles, Quartiles, and boxplots
- position: $pth$ percentile
-
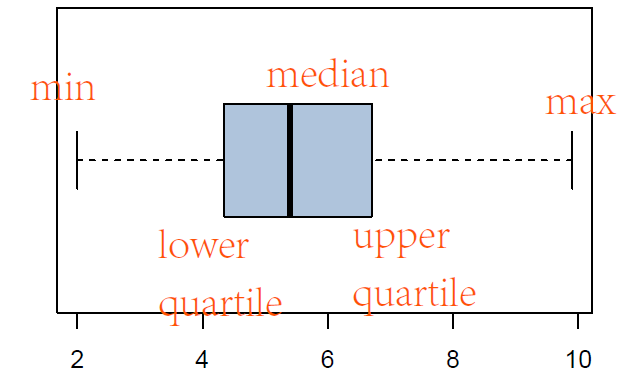
The $pth$ percentile is the point such that $ p \% $ of the observations fall below or at that point and $ (100-p) \% $ fall above it. For example, for $ p=95 $, the $95 th$ percentile falls above $ 95 \% $ of the observations and below $ 5 \% $ of them. The $50 th$ percentile is the median.
-
Quantiles are percentiles expressed in proportion form. For example, the $95 th$ percentile is also called the $ 0.95 $ quantiles.
- lower quartile: the $25 th$ percentile
- upper quartile: the $75 th$ percentile
- The quartiles together with the median split the distribution into four parts, each containing one-fourth of the observations.
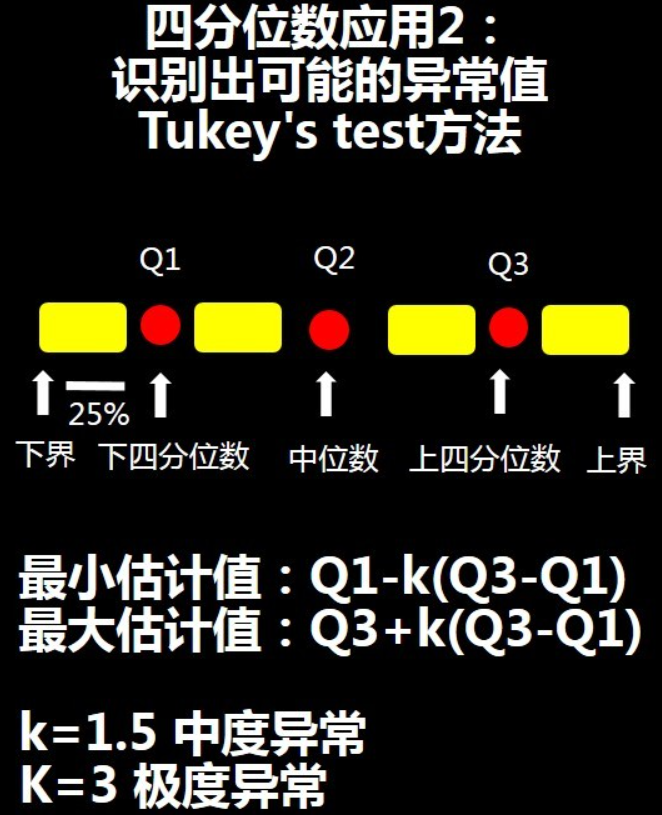
- The interquartile range, denoted by IQR, is the difference between the upper quartile and the lower quartile.
Unlike the ordinary range, the IQR is not affected by outliers and takes into account variability by observations other than the most extreme ones.
basic statistical analysis with pandas
# Carbon dioxide emission in European Nations

import pandas as pd

Carbon = pd.read_csv('http://stat4ds.rwth-aachen.de/data/Carbon.dat', sep='\s+')

# data manupulation
Carbon.shape  # (31,2), without header
Carbon.columns  # Index(['Nation', 'CO2'], dtype='object')
Carbon.head()   # first 5 rows
Carbon.tail()   # last 5 rows
Carbon.info()

# find some descriptive statistics
Carbon.describe()   # summary statistics: mean, std, min, max, 25%, 50%, 75%
Carbon['CO2'].mean()    #mean of CO2
Carbon['CO2'].std()     #standard deviation of CO2
Carbon['CO2'].min()     #minimum of CO2
Carbon['CO2'].max()     #maximum of CO2
Carbon['CO2'].median()  #median of CO2

# histogram of CO2
import matplotlib.pyplot as plt
import seaborn; seaborn.set()  # set the style of the plots

plt.hist(Carbon['CO2'], density=True, bins=8)
plt.xlabel('CO2')
plt.ylabel('proportion')
plt.title('Histogram of CO2')

# boxplot
plt.boxplot(Carbon['CO2'], vert=False)
Comments 1 条评论
I need to to thank you for this good read!! I definitely loved every little bit of it. I have you book-marked to look at new things you postÖ