https://pypi.org/project/SciencePlots/
Github上超火的科研论文库:SCIENCEPLOTS,免除繁复的颜色和格式调试。
安装
安装方法可以参考上一篇博文
1.pip直接安装
pip install git+https://github.com/garrettj403/SciencePlots.git
2.最新版本
pip install SciencePlots
一般来说,Python3已经内置此包
常规作图
SciencePlots默认使用Latex字体渲染,而相应软件安装较为麻烦,以下样例均采用禁用Latex字体渲染,即设置 no-latex
1.导入所需库
%matplotlib notebook #用于jupyter行内显示图,如果使用spyder或其他IDE则不需要
import matplotlib.pyplot as plt
import numpy as np
import SciencePlots
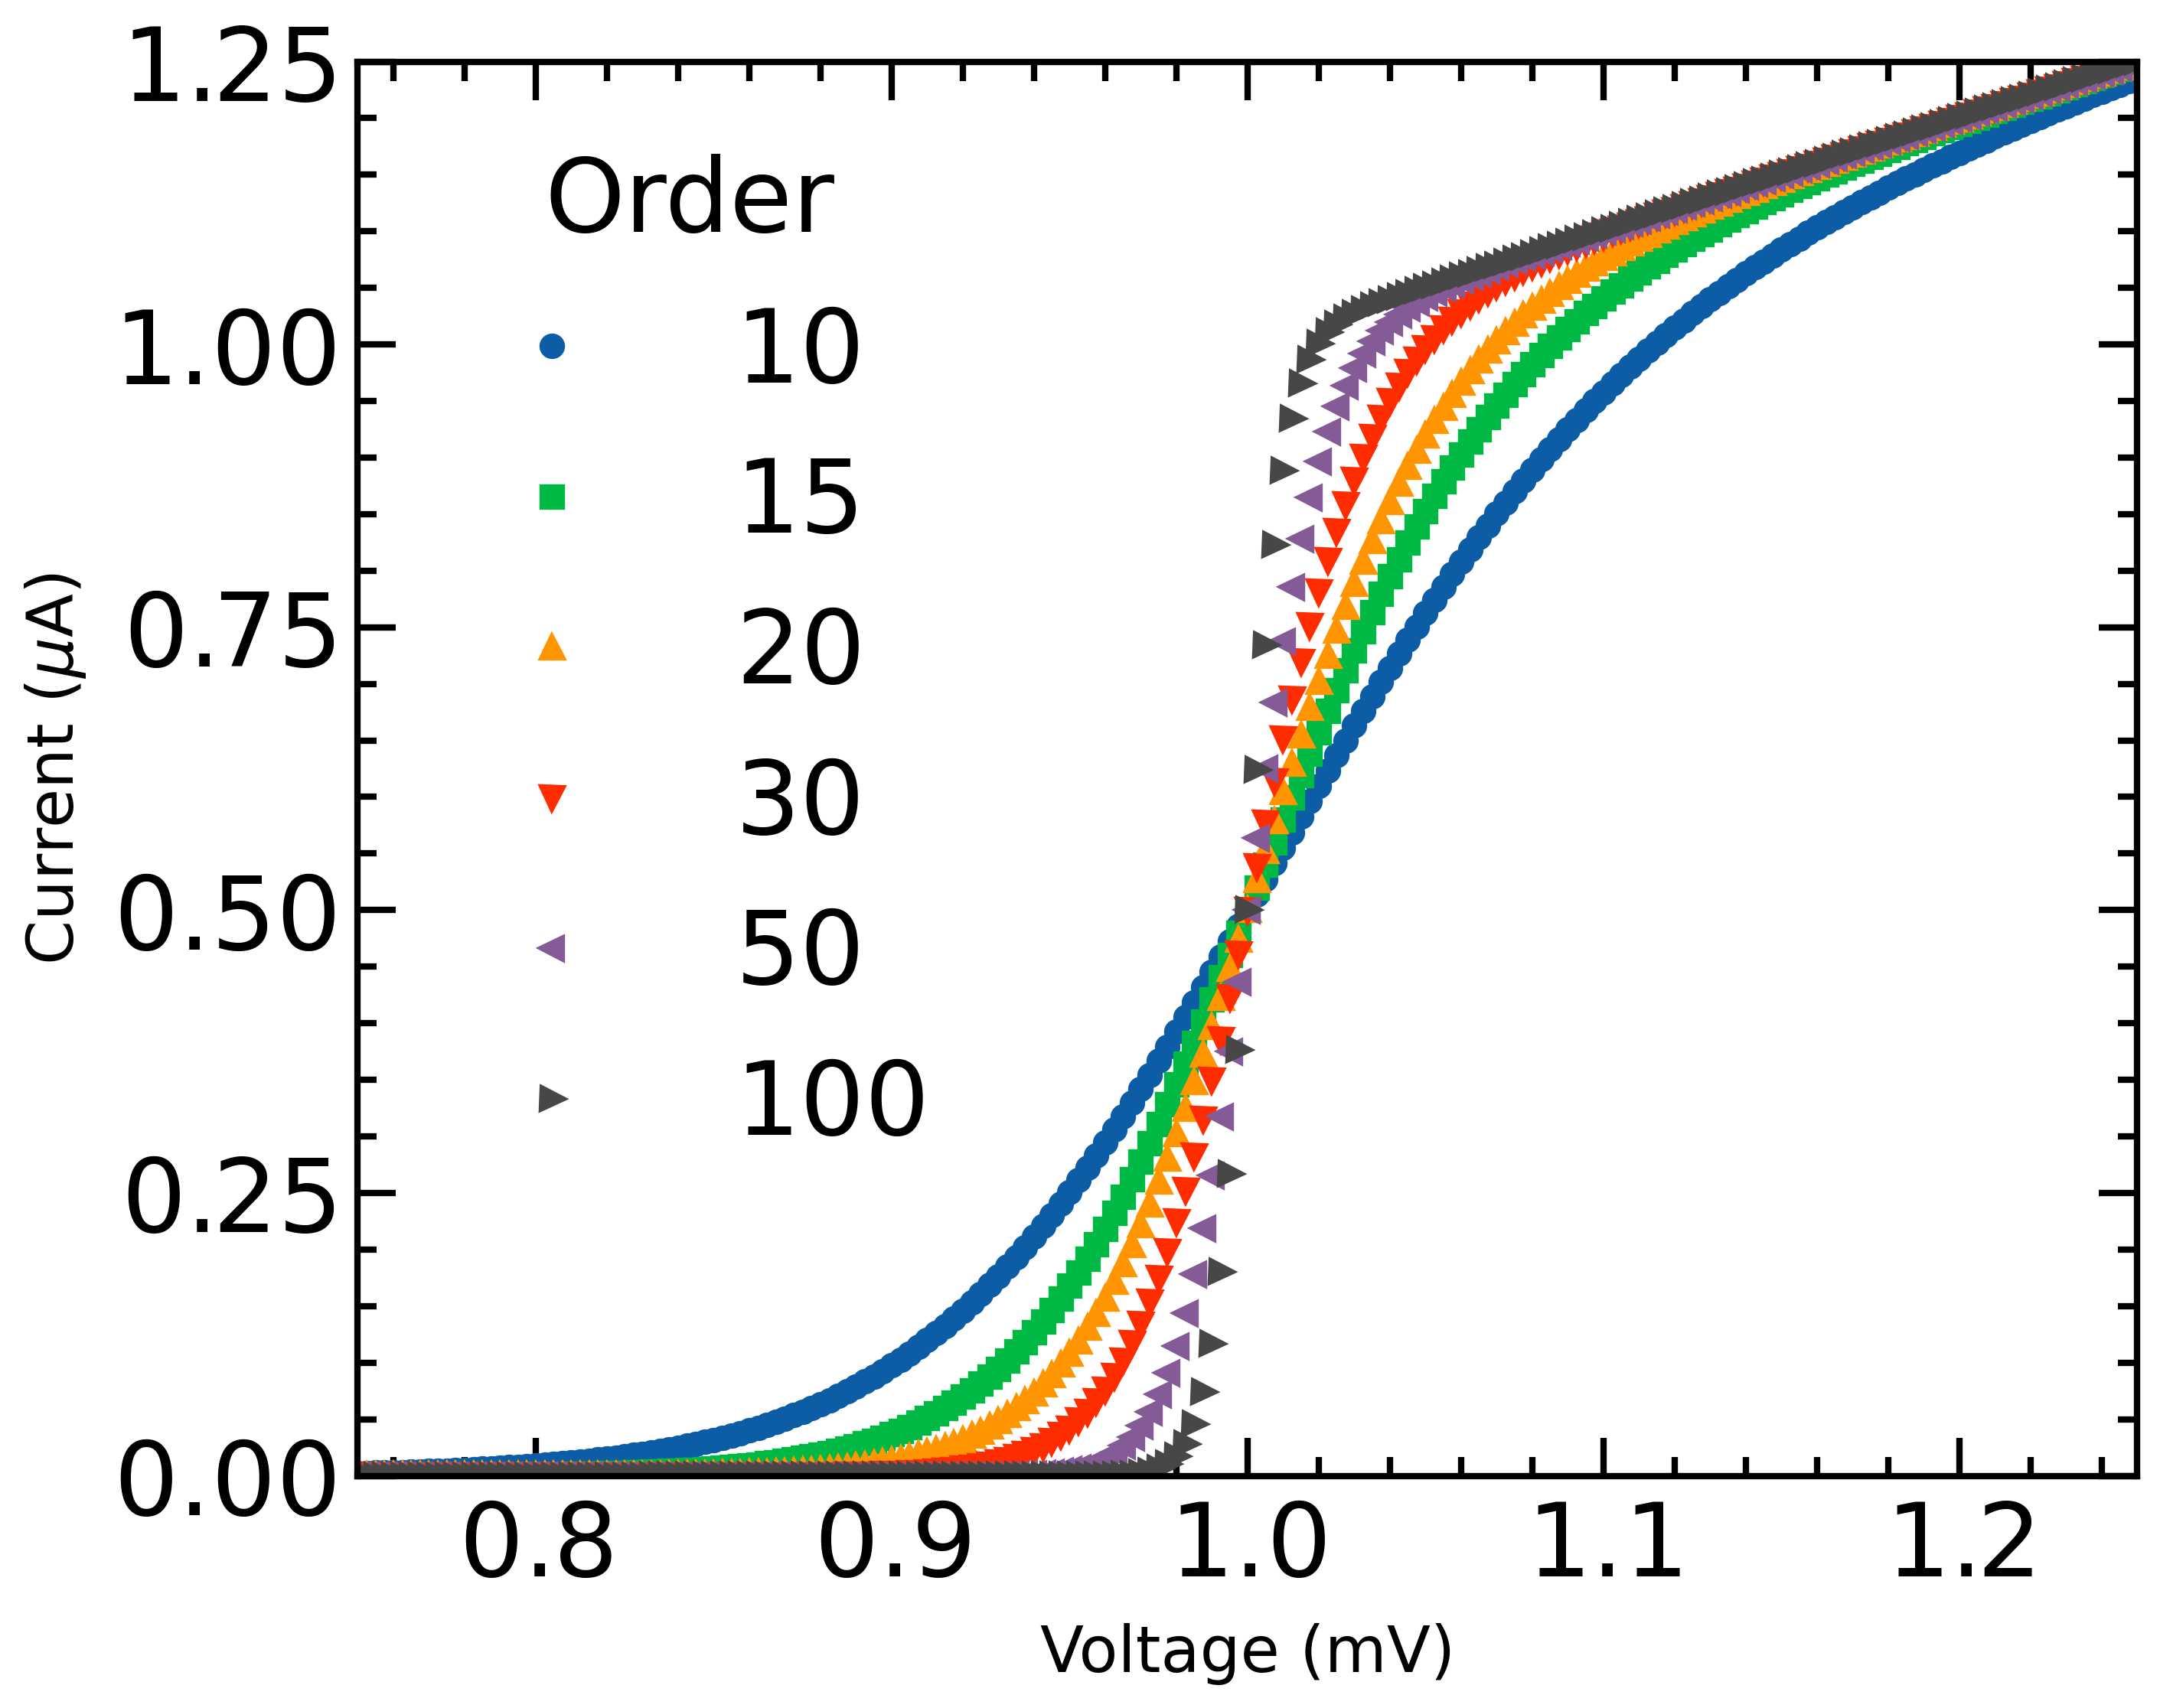
2.准备数据,此处使用官网提供数据
import numpy as np
import matplotlib.pyplot as plt
def model(x, p):
    return x ** (2 * p + 1) / (1 + x ** (2 * p))
x = np.linspace(0.75, 1.25, 201)
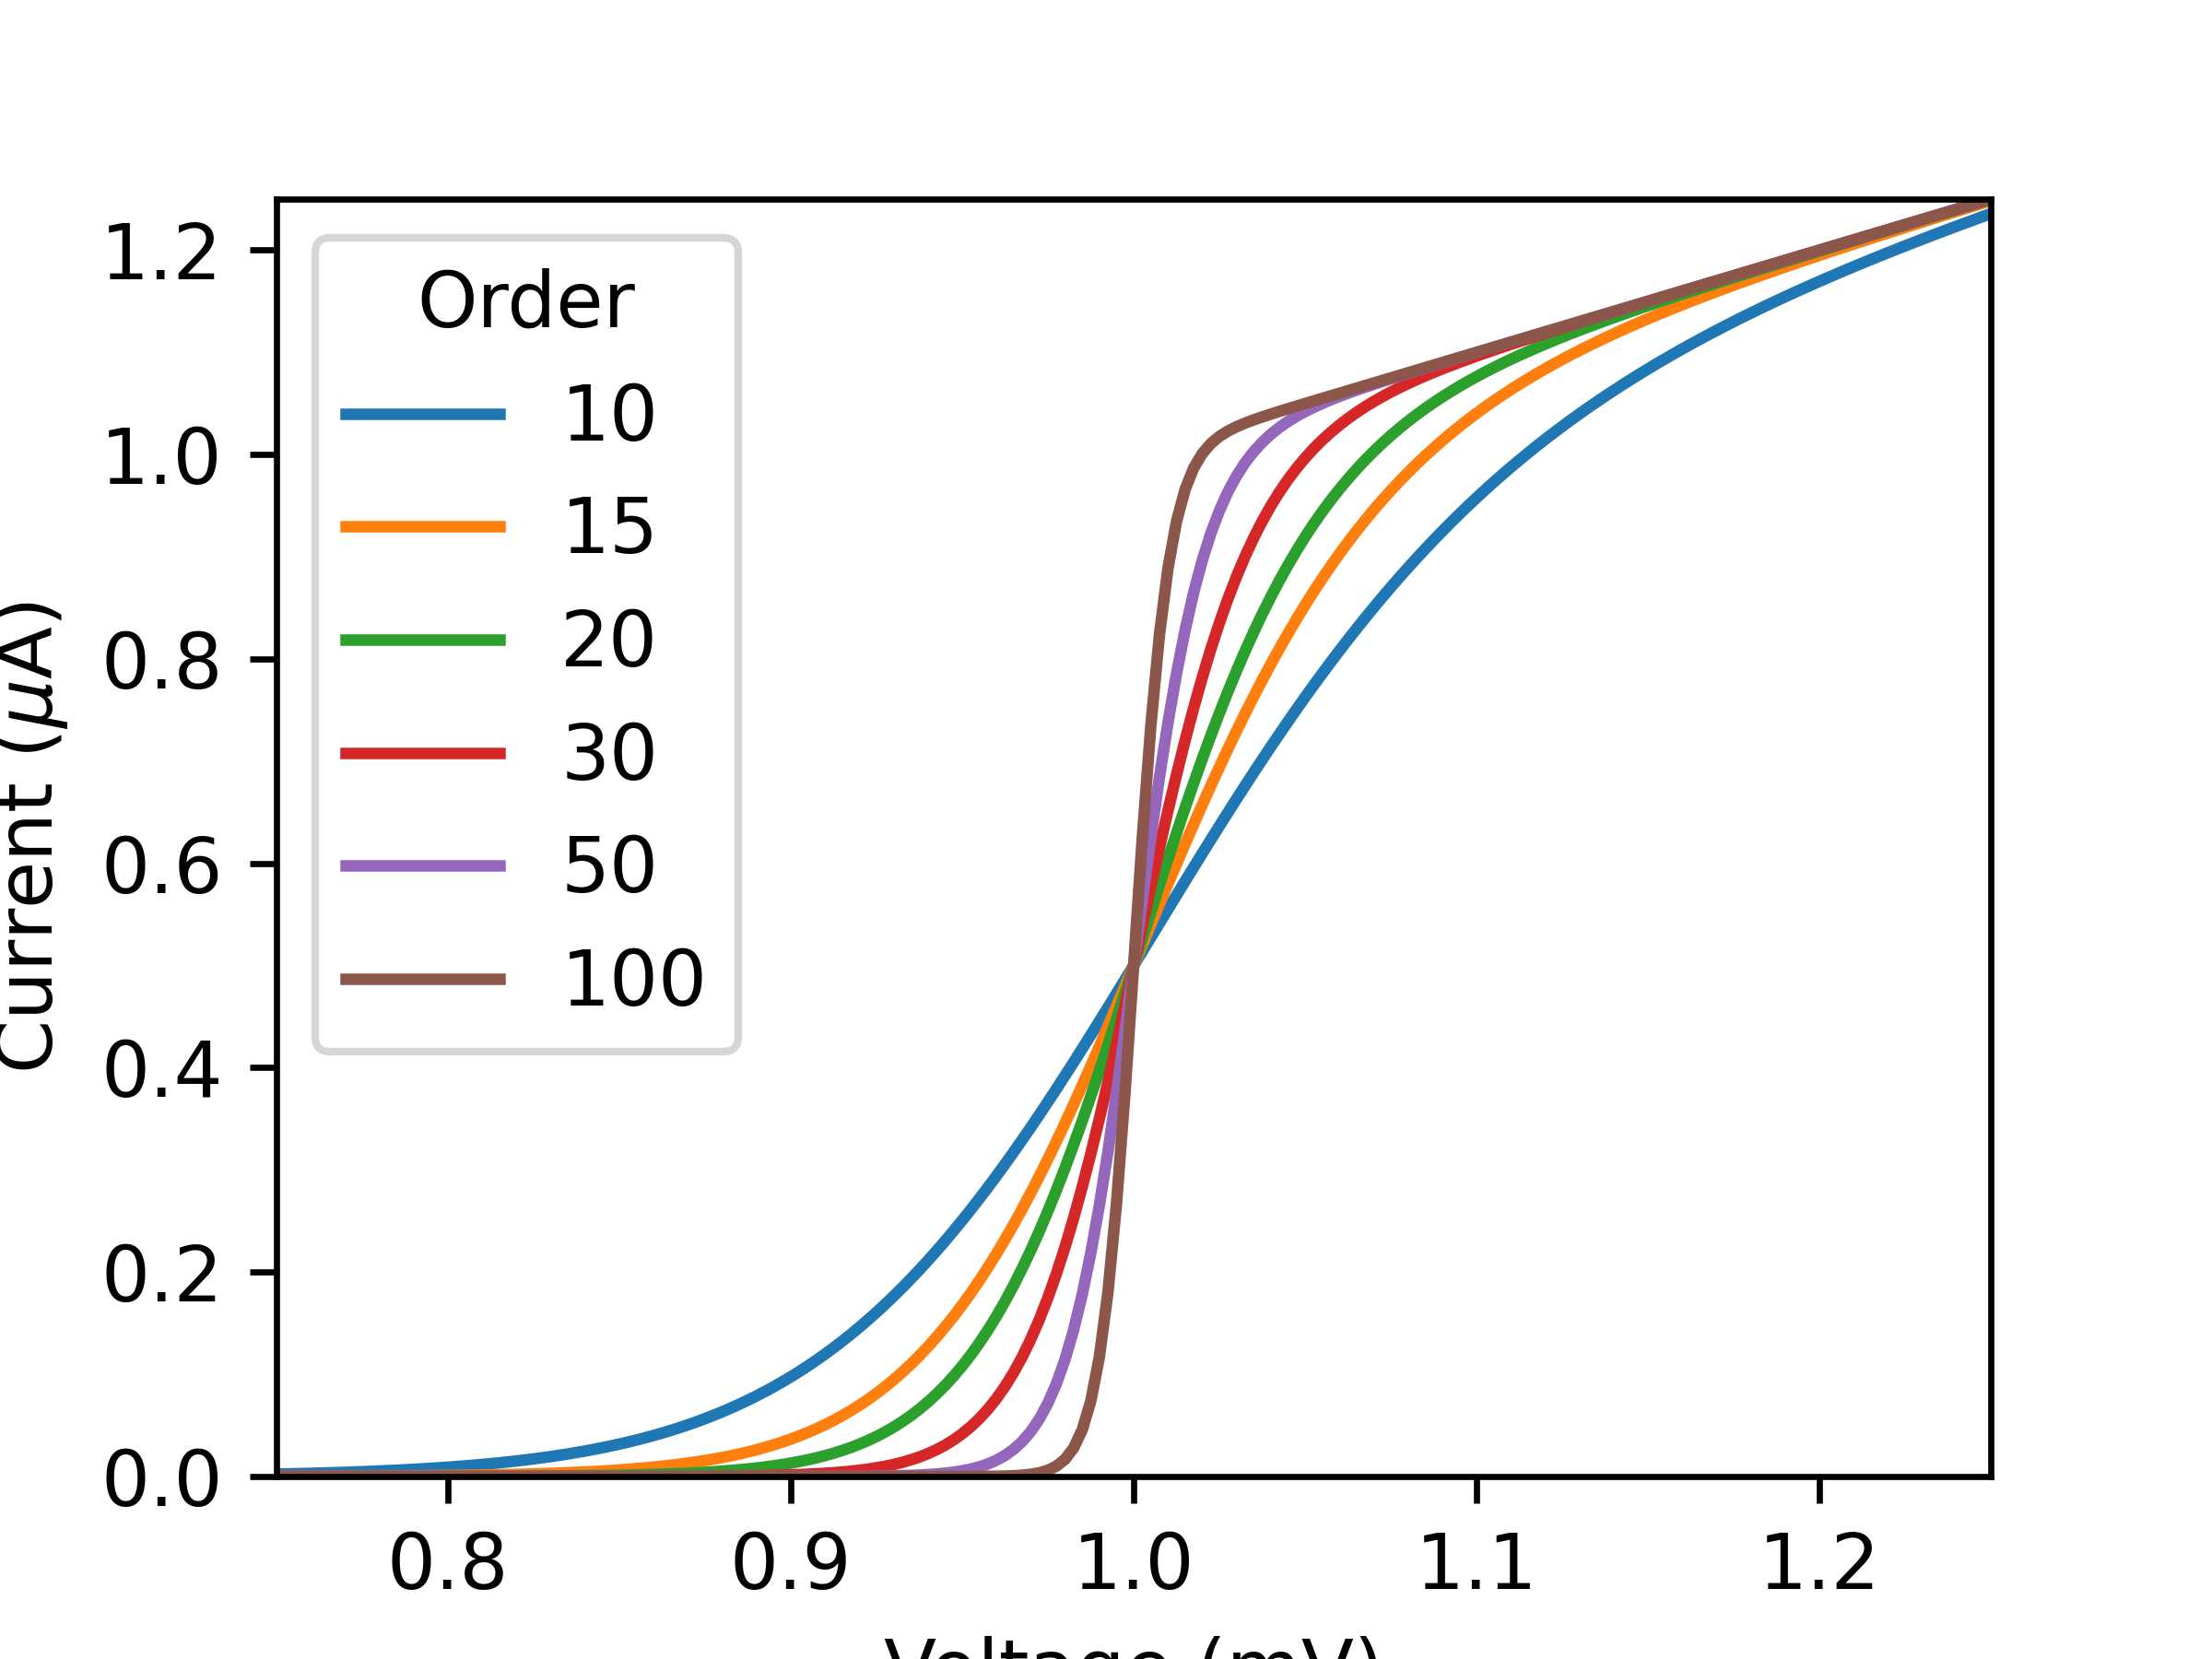
3.常规方法作图
fig, ax = plt.subplots(figsize=(4,3),dpi=200)
for p in [10, 15, 20, 30, 50, 100]:
    ax.plot(x, model(x, p), label=p)
ax.legend(title='Order')
ax.set(xlabel='Voltage (mV)')
ax.set(ylabel='Current ($\mu$A)')
ax.autoscale(tight=True)
fig.savefig('H:\\fig1.png',dpi=600)
*注意源代码中保存图片:
fig.savefig(r'F:\DataCharm\学术图表绘制\Python-matplotlib\SciencePlots\fig1.png',
            width=4,height=3,dpi=600)
但是会报错,因为:
matplotlib.pyplot.savefigsavefig(fname, *, dpi='figure', format=None, metadata=None,
        bbox_inches=None, pad_inches=0.1,
        facecolor='auto', edgecolor='auto',
        backend=None, **kwargs
       )
savefig
不存在长宽的输入参数,实际上fig, ax = plt.subplots(figsize=(4,3),dpi=200)这里已经设置了尺寸
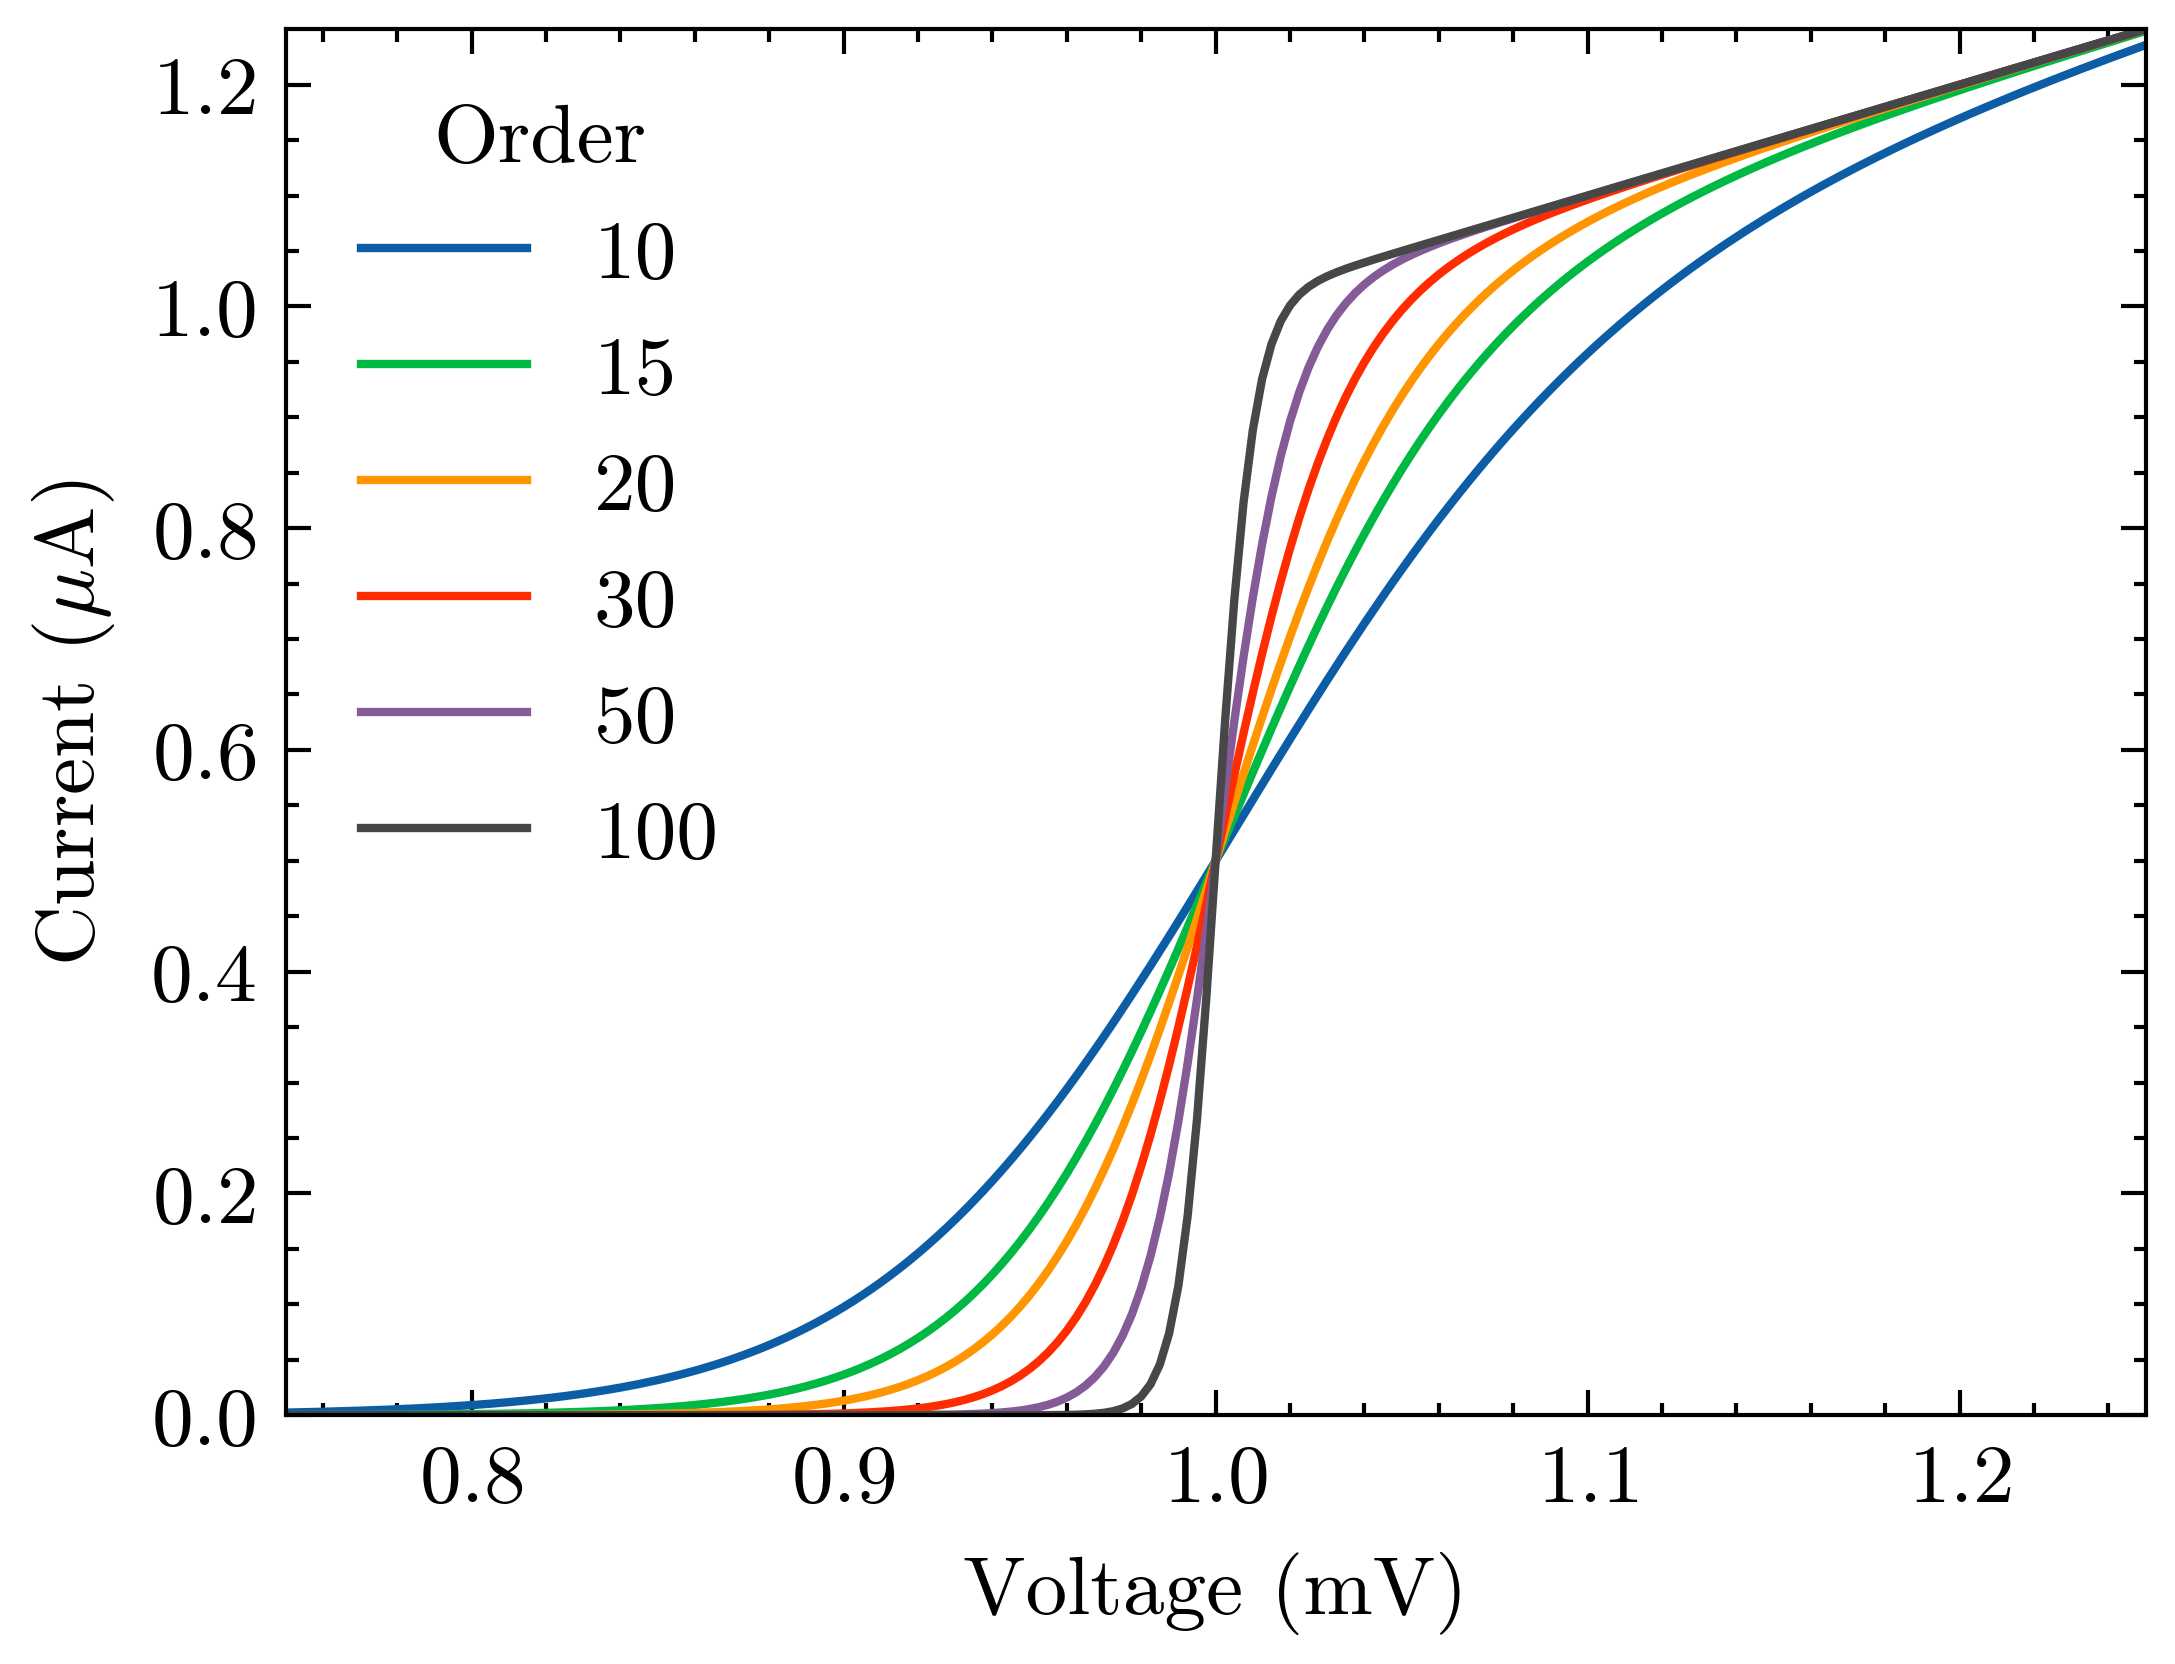
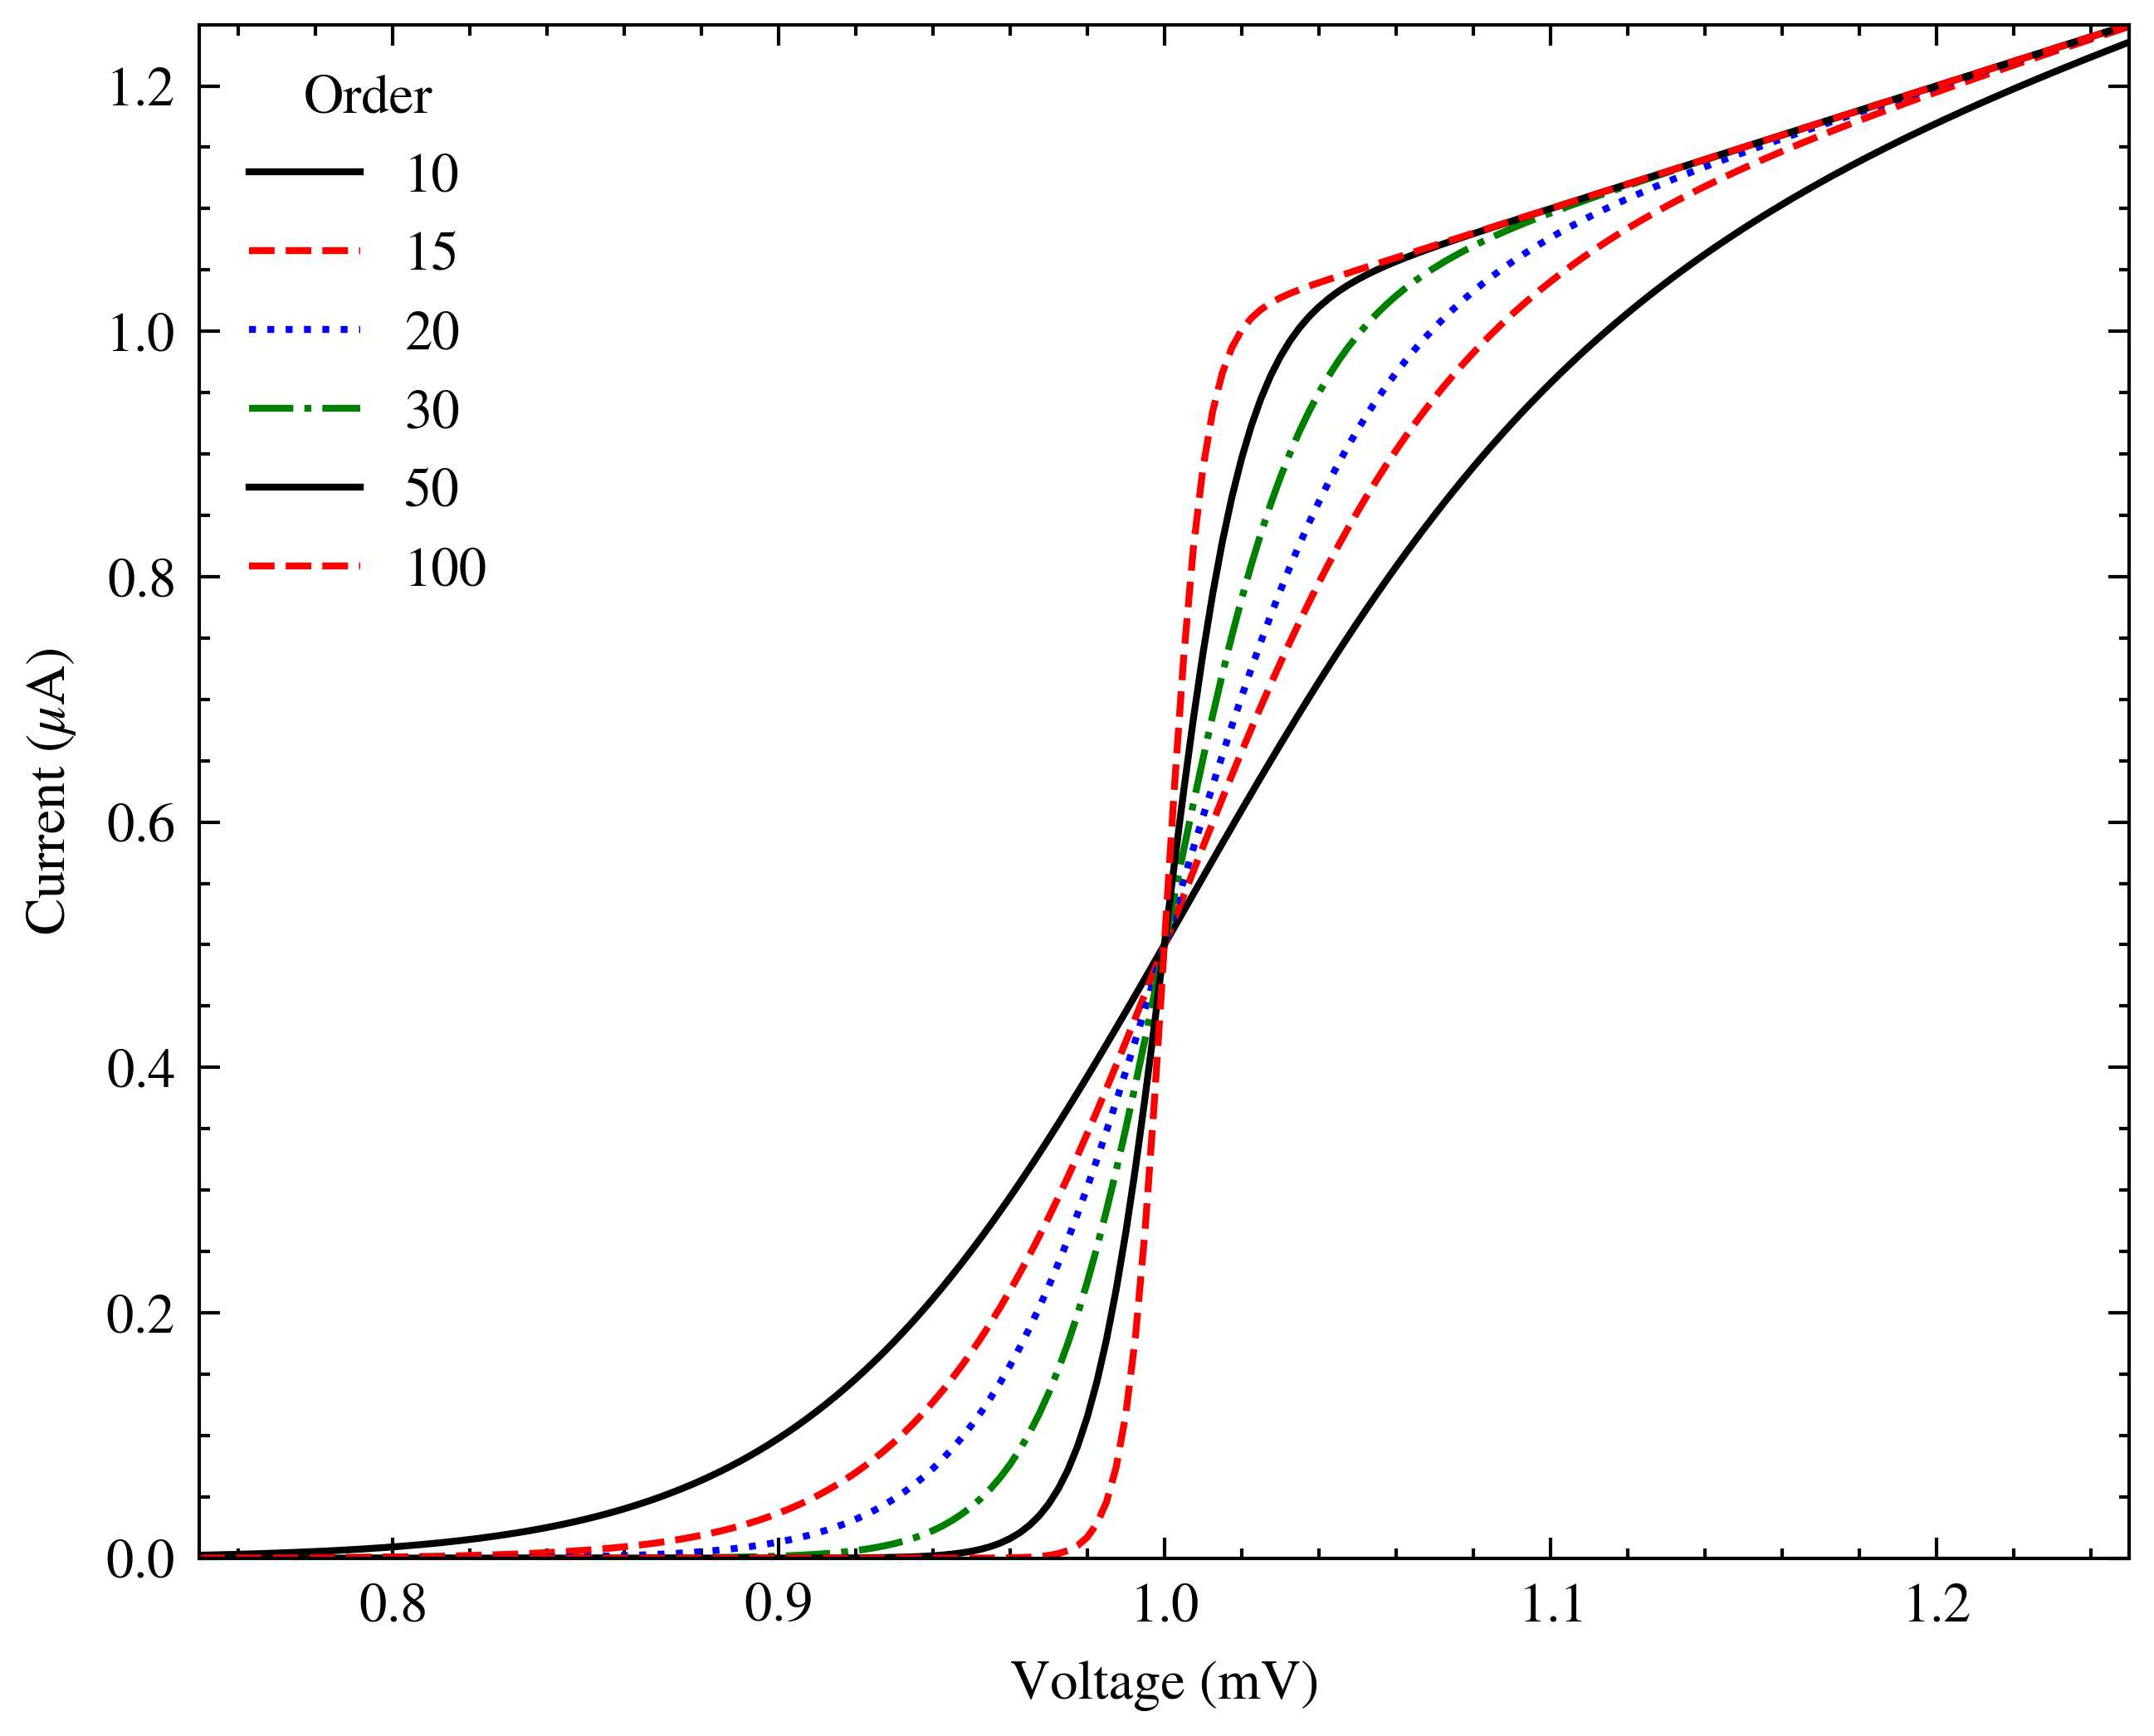
SciencePlots作图
with plt.style.context(['science','no-latex']):
    fig, ax = plt.subplots(figsize=(4,3),dpi=200)
    for p in [10, 15, 20, 30, 50, 100]:
        ax.plot(x, model(x, p), label=p)
    ax.legend(title='Order')
    ax.set(xlabel='Voltage (mV)')
    ax.set(ylabel='Current ($\mu$A)')
    ax.autoscale(tight=True)
    fig.savefig(r'H:\\fig1_science.png',dpi=600)
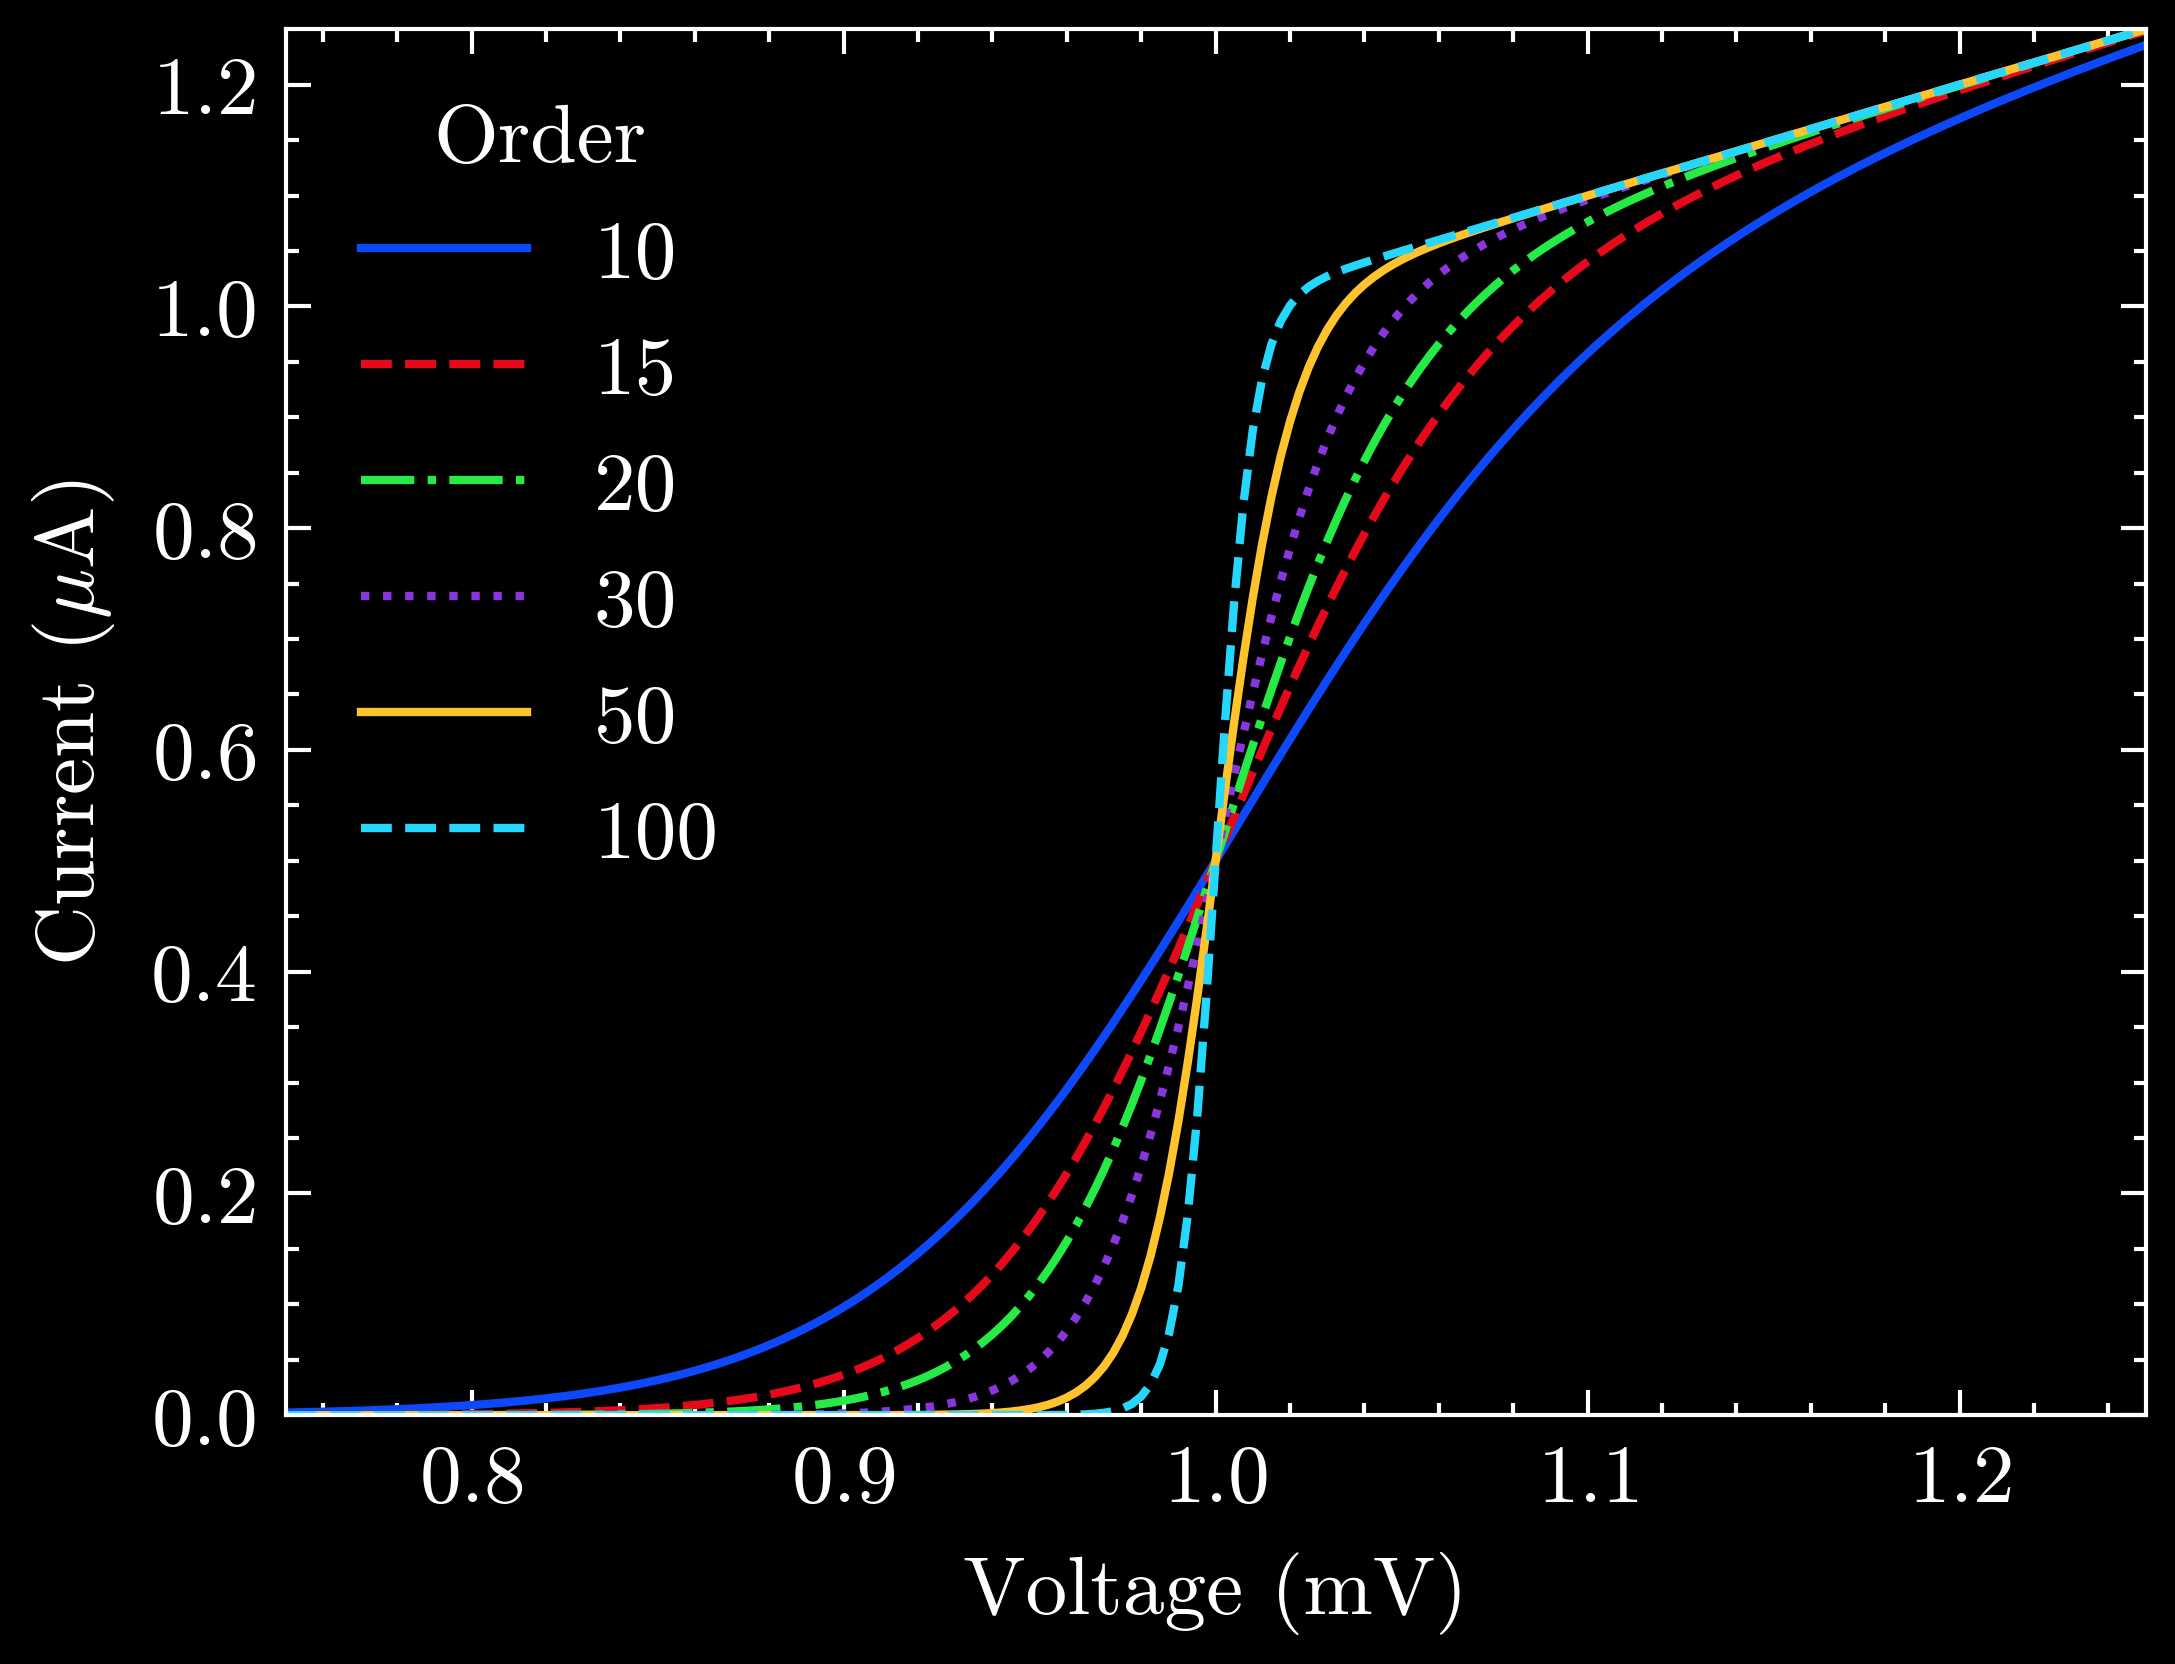
with plt.style.context(['dark_background', 'science', 'high-vis','no-latex']):
    fig, ax = plt.subplots(figsize=(4,3),dpi=200)
    for p in [10, 15, 20, 30, 50, 100]:
        ax.plot(x, model(x, p), label=p)
    ax.legend(title='Order')
    ax.set(xlabel='Voltage (mV)')
    ax.set(ylabel='Current ($\mu$A)')
    ax.autoscale(tight=True)
    fig.savefig(r'H:\\fig1_science.png',dpi=600)
常用style
完整列表查看:Style Gallery
with plt.style.context('science'):
with plt.style.context(['science','grid','no-latex']):
with plt.style.context(['science','notebook','no-latex']):
with plt.style.context(['science','notebook','scatter','no-latex']):
with plt.style.context(['science','notebook','scatter','no-latex']):
    fig, ax = plt.subplots(figsize=(5,4),dpi=200)
    for p in [10, 15, 20, 30, 50, 100]:
        ax.plot(x, model(x, p), label=p)
    ax.legend(title='Order')
    ax.set(xlabel='Voltage (mV)')
    ax.set(ylabel='Current ($\mu$A)')
    ax.autoscale(tight=True)
    fig.savefig(r'H:\\fig1_science.png',dpi=600)
IEEE
with plt.style.context(['science','ieee','no-latex']):
with plt.style.context(['science','ieee','no-latex']):
    fig, ax = plt.subplots(figsize=(5,4),dpi=200)
    for p in [10, 15, 20, 30, 50, 100]:
        ax.plot(x, model(x, p), label=p)
    ax.legend(title='Order')
    ax.set(xlabel='Voltage (mV)')
    ax.set(ylabel='Current ($\mu$A)')
    ax.autoscale(tight=True)
    fig.savefig(r'H:\\fig1_science.png',dpi=600)
*IEEE requires figures to be readable when printed in black and white. The ieee style also sets the figure width to fit within one column of an IEEE paper and the resolution to 600 DPI.
Note: The IEEE style will make your figures massive if you use it with plt.show(). To get around this, you can add plt.rcParams.update({'figure.dpi': '100'}) to the top of your script (see issue).
Comments NOTHING