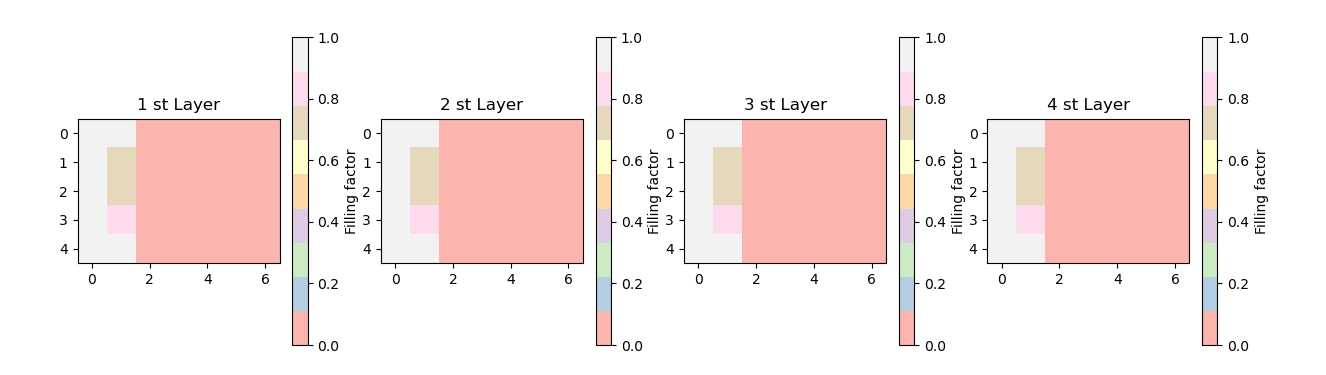
f=[1, 1.0, 0, 0, 0, 0, 0, 1, 0.73076923, 0, 0, 0, 0, 0, 1, 0.69230769, 0, 0, 0, 0, 0, 1, 0.80769231, 0, 0, 0, 0, 0, 1, 1.0, 0, 0, 0, 0, 0, 1, 1.0, 0, 0, 0, 0, 0, 1, 0.73076923, 0, 0, 0, 0, 0, 1, 0.69230769, 0, 0, 0, 0, 0, 1, 0.80769231, 0, 0, 0, 0, 0, 1, 1.0, 0, 0, 0, 0, 0, 1, 1.0, 0, 0, 0, 0, 0, 1, 0.73076923, 0, 0, 0, 0, 0, 1, 0.69230769, 0, 0, 0, 0, 0, 1, 0.80769231, 0, 0, 0, 0, 0, 1, 1.0, 0, 0, 0, 0, 0, 1, 1.0, 0, 0, 0, 0, 0, 1, 0.73076923, 0, 0, 0, 0, 0, 1, 0.69230769, 0, 0, 0, 0, 0, 1, 0.80769231, 0, 0, 0, 0, 0, 1, 1.0, 0, 0, 0, 0, 0]
f1=(np.array(f)).reshape(4,5,7)
###########
figurem,figuren=1,4
X,Y=np.meshgrid(x,y)
fig,ax = plt.subplots(nrows=figurem,ncols=figuren,figsize = (15,4))#, dpi=100
plt.xlim(0, L)
plt.ylim(0, W)
plt.title('Filling factor')
for i in range(1,int(figurem*figuren+1)):
ax1=plt.subplot(figurem,figuren,i)
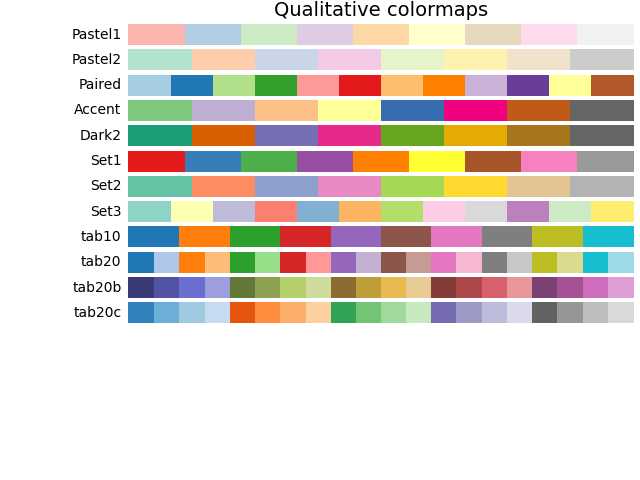
plt.imshow(f1[i-1], cmap=plt.cm.Pastel1)#rainbow
ax1.set_title('%.0f st Layer'%i)
plt.colorbar(label='Filling factor')
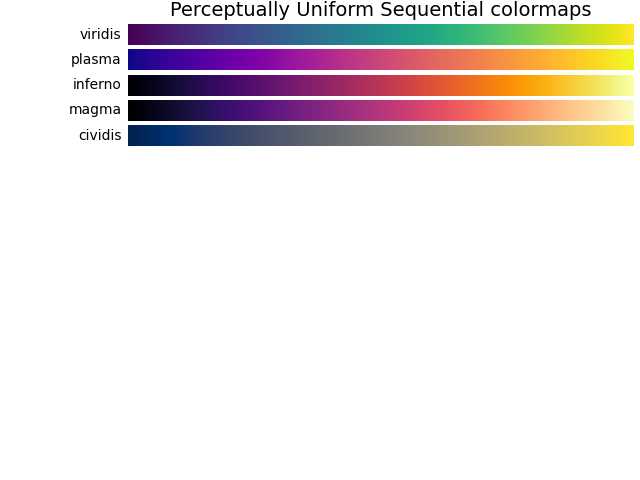
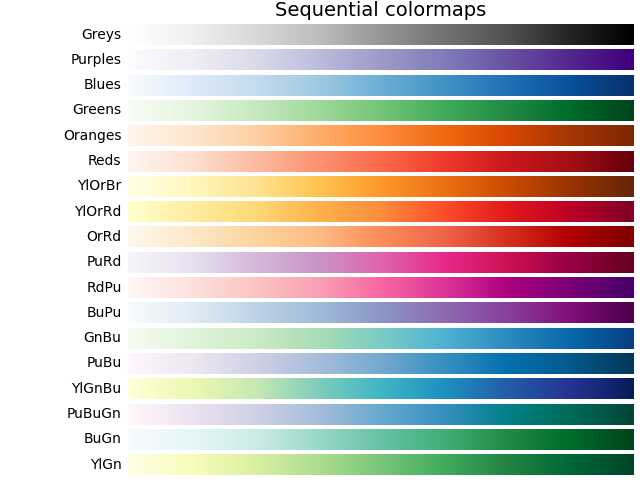
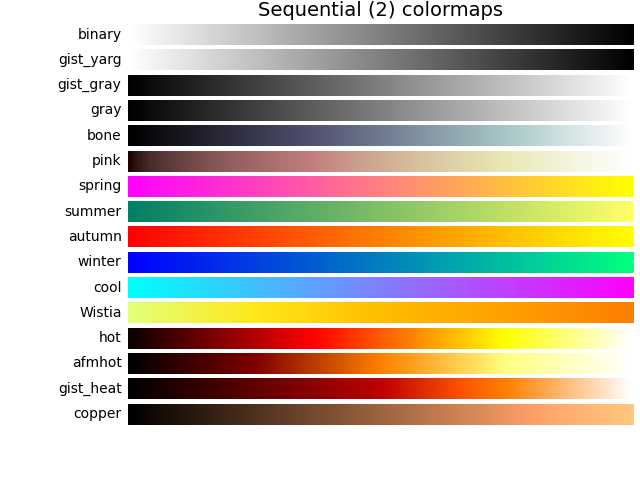
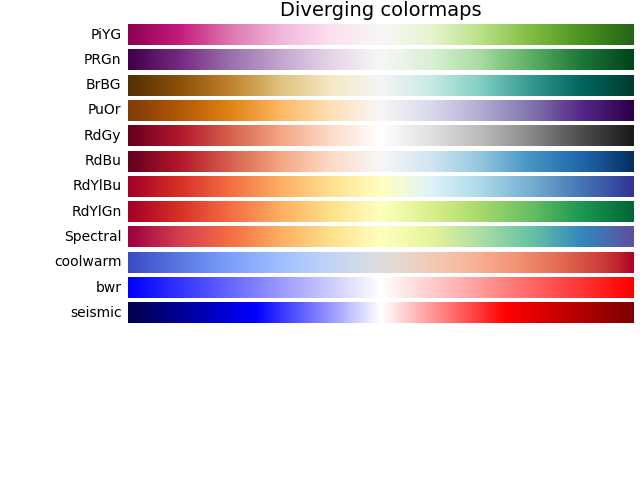
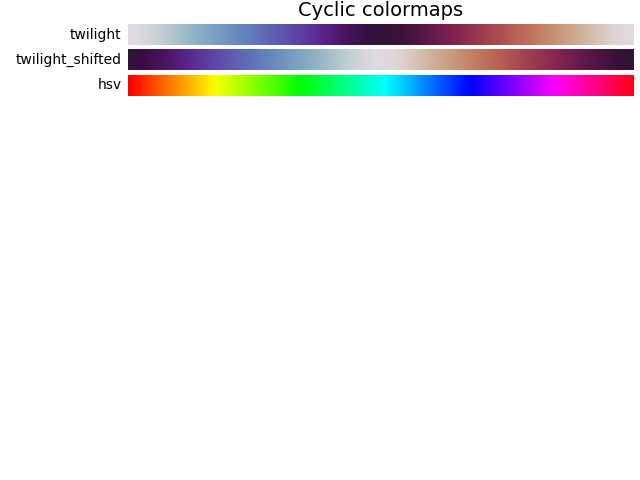
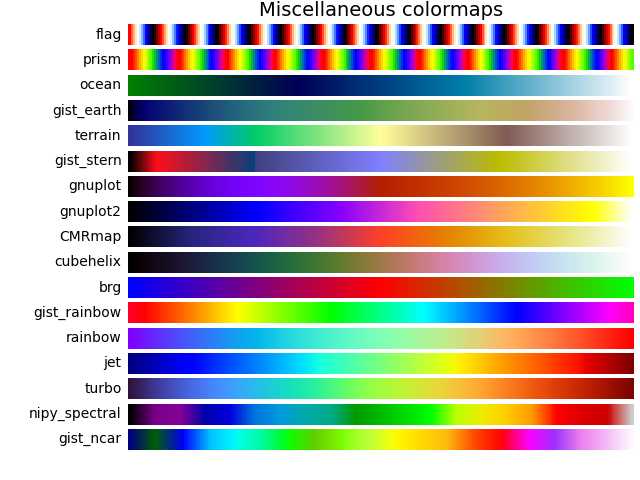
所有的绘图函数里都包含了colormap类
可以使用cmap参数进行设置
参见:https://www.osgeo.cn/matplotlib/tutorials/colors/colormaps.html
https://matplotlib.org/stable/tutorials/colors/colormaps.html
Comments NOTHING